


Business Process Model and Notation (BPMN) serves as the universal language for process modeling. However, a diagram containing only tasks and gateways often fails to capture the full reality of how a business operates. The substance of a process lies in the data that moves through it. Without visualizing data inputs and outputs, a BPMN diagram remains a skeletal structure rather than a functional blueprint. This guide explores how to effectively represent data flow, ensuring clarity, accuracy, and usability in your process models.
When modeling complex workflows, stakeholders need to understand not just what happens, but what information drives those actions. Proper visualization of data prevents ambiguity during implementation and aids in system integration. By adhering to BPMN 2.0 standards, you can create diagrams that communicate both the logic and the data requirements simultaneously.
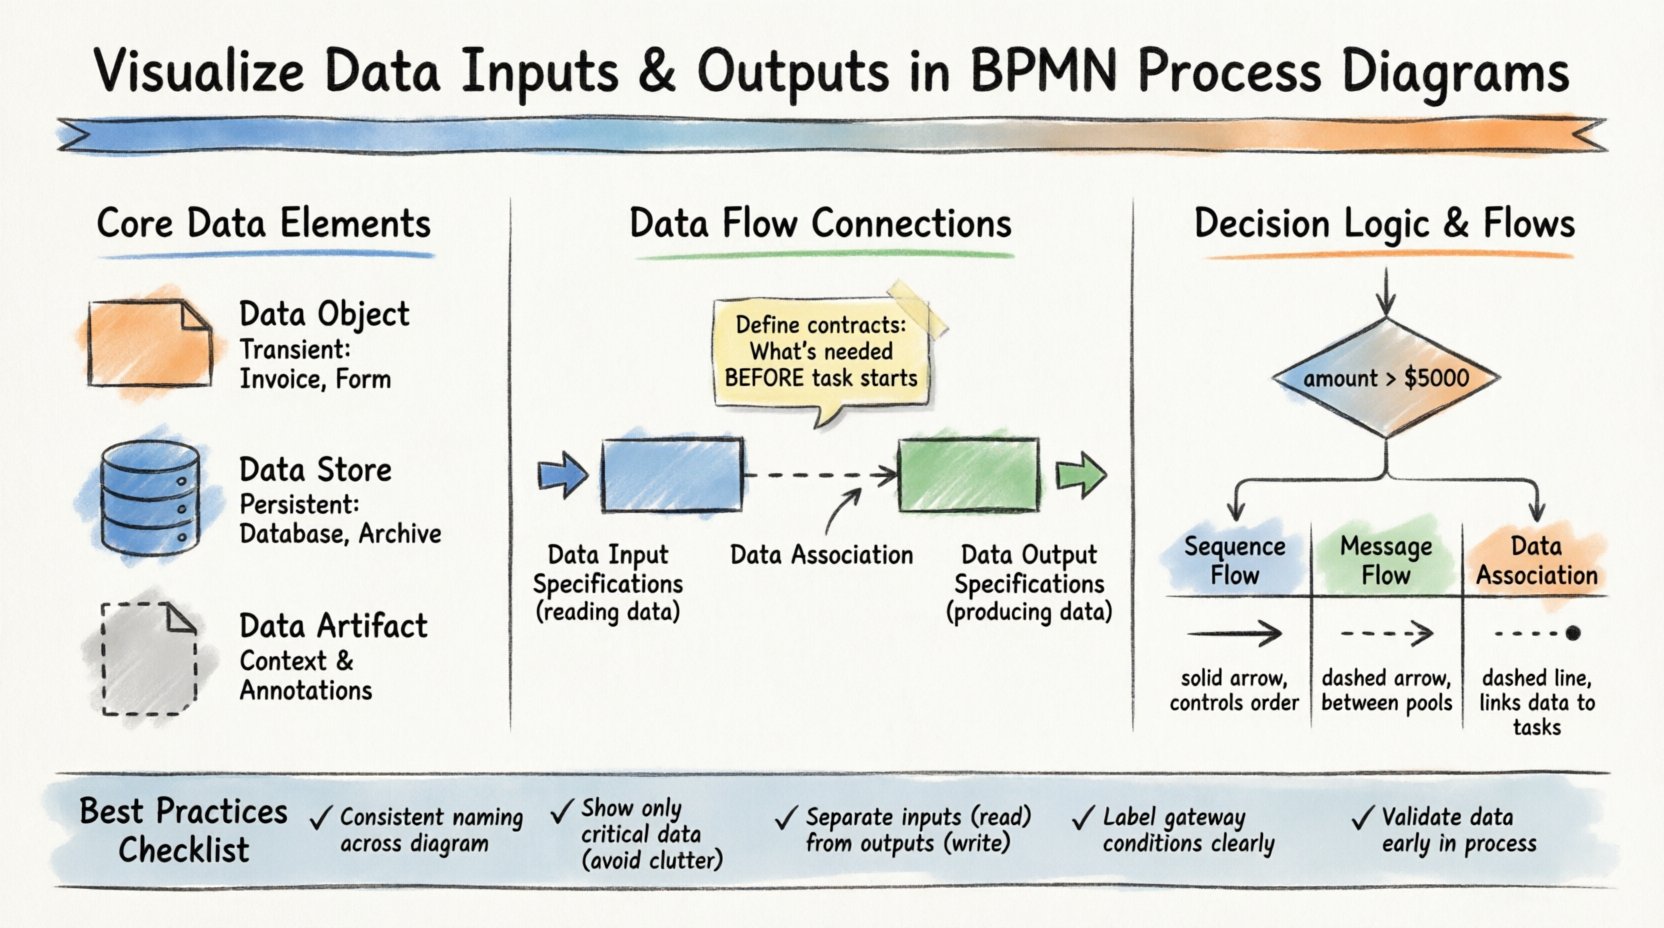
🏗️ Understanding Core Data Elements in BPMN
To visualize data correctly, one must distinguish between the different types of data artifacts available in the notation. Confusing these elements can lead to misunderstandings about where information is stored, how it is passed, or when it is generated.
📄 Data Objects
Data objects represent information that is created or consumed during the execution of a process. They are transient and typically exist only for the duration of the process instance. Think of them as documents, forms, or records that appear on a desk during a meeting.
- Definition: A symbol indicating that data is involved in a specific task or event.
- Usage: Attach to tasks to show what is read or written.
- Visual Style: A rectangle with a folded corner.
- Example: An “Invoice” generated by a “Process Payment” task.
Data objects are crucial for showing the immediate needs of a task. If a task requires a customer signature, a data object representing the “Signed Contract” should be visible. This signals to the reader that the task cannot complete without this specific input.
🗃️ Data Stores
Unlike data objects, data stores represent persistent repositories. These are databases, file systems, or external systems where information is saved for long-term retention. In a diagram, they indicate where data originates or where it is archived.
- Definition: A symbol indicating a database or storage mechanism.
- Usage: Connect to tasks or pools to show data persistence.
- Visual Style: A cylinder shape.
- Example: A “Customer Database” or “Order Archive”.
Using data stores correctly helps distinguish between temporary information and permanent records. This distinction is vital for data governance and compliance requirements.
📋 Data Artifacts
While not strictly data, data artifacts provide additional context about the data being used. They are often used to explain the source or destination of a data set without implying a direct flow.
- Definition: Annotations that describe data requirements.
- Usage: Clarify data formats or sources.
- Visual Style: A document icon with a dashed line connection.
🔗 Connecting Data to Tasks: Inputs and Outputs
The most critical aspect of visualizing data within BPMN is linking it to the activities that consume or produce it. This is achieved through Data Input Specifications and Data Output Specifications. These are not just decorative elements; they define the contract between the process and the data.
📥 Data Input Specifications
Every task that processes information needs input. In BPMN, this is explicitly modeled to ensure nothing is assumed. A task should never rely on implicit data. You must define what data is required before the task begins.
- Role: Defines the data required to start a task.
- Association: Connected to the task via a data association line.
- Validation: Ensures the task has all necessary variables before execution.
- Example: A “Review Application” task requires “Application Form” as an input.
When modeling inputs, consider whether the data is mandatory or optional. If a task cannot proceed without specific data, it must be clearly marked. This reduces errors during the development of automated workflows.
📤 Data Output Specifications
Tasks also produce results. These results may be new data objects or updates to existing data stores. Visualizing outputs ensures that downstream tasks know what information is available to them.
- Role: Defines the data produced by a task.
- Association: Connected to the task via a data association line.
- Propagation: Makes the data available for subsequent tasks or events.
- Example: A “Approve Loan” task produces “Approved Loan Document”.
Clear output definitions prevent data silos. If a task creates a document, the next task should reference that document explicitly. This creates a traceable chain of custody for information within the process.
⚖️ Data Logic in Gateways and Decisions
Data does not just flow linearly; it often dictates the path of a process. Gateways make decisions based on data values. Visualizing these conditions is essential for understanding how data drives process branching.
🔢 Exclusive Gateways and Data Conditions
An Exclusive Gateway (the diamond shape) splits the process into one of several paths. The path taken depends on the evaluation of data. To visualize this, you must annotate the outgoing sequence flows with data-based conditions.
- Condition: A Boolean expression (e.g.,
amount > 5000). - Source: The data must be available at the point of the gateway.
- Clarity: Label every path with the specific data value that triggers it.
For example, if a process routes orders based on value, the gateway must clearly show the threshold. If the data value changes, the path changes. This logic must be visible to stakeholders who might not understand the underlying code.
🔄 Inclusive and Parallel Gateways
While Exclusive Gateways choose one path, Inclusive Gateways can choose multiple paths based on data. Parallel Gateways split and join flows regardless of data, but they often operate on data sets created by previous tasks.
- Inclusive Gateway: Activates paths where data conditions evaluate to true.
- Parallel Gateway: Activates all paths simultaneously; data flows are synchronized.
When visualizing data in these scenarios, ensure that the data required for each parallel branch is clearly defined. If Branch A needs “Customer ID” and Branch B needs “Order ID”, both inputs should be visible before the parallel split.
💬 Message Flows vs. Data Flows
A common point of confusion in BPMN is the distinction between Sequence Flows, Message Flows, and Data Associations. Understanding this difference is key to accurate visualization.
| Flow Type | Scope | Function | Visual Representation |
|---|---|---|---|
| Sequence Flow | Within a Pool | Controls task order | Solid Arrow |
| Message Flow | Between Pools/Participants | Exchanges messages | Dashed Arrow |
| Data Association | Within a Pool | Links data to tasks | Dashed Line (non-directional) |
Message Flows carry the data itself across boundaries. When a customer sends an order, the message flow carries the order data. Sequence Flows carry control, not data. Data Associations link the abstract data objects to the tasks that process them.
When modeling external interactions, use Message Flows to show that data is leaving the process boundary. Use Data Associations to show that a task is reading from a local database. Mixing these up can confuse developers who are building the integration points.
🛡️ Best Practices for Data Visualization
To maintain high-quality diagrams, follow these established practices. Consistency reduces cognitive load for anyone reviewing the model.
- Consistent Naming: Always use the same name for a data object across the entire diagram. If it is called “Invoice” in Task A, do not call it “Bill” in Task B.
- Minimal Clutter: Do not attach every single variable to a task. Only show data that is critical to the understanding of the process.
- Logical Grouping: Group related data objects together. If a task involves “Shipping Address” and “Billing Address”, keep them visually proximate.
- Version Control: If the data structure changes, update the diagram. Outdated data models lead to failed implementations.
- Input/Output Separation: Clearly distinguish between what is read (Input) and what is written (Output). This helps in identifying read-only tasks versus write-heavy tasks.
🚧 Common Pitfalls to Avoid
Even experienced modelers make mistakes when representing data. Recognizing these common errors helps refine your diagrams.
🕵️ Missing Data Associations
One frequent issue is assuming data exists without showing it. If a task calculates a total, where does the price come from? If the data object is missing from the diagram, the process logic is incomplete.
🔁 Circular Data Dependencies
Ensure data flows logically. A task should not depend on data that is produced by a future task in the same sequence flow. This creates a logical paradox that cannot be executed.
🧩 Over-Specification
Do not model every single database field. Focus on the business-relevant data. If a task processes an “Order”, you do not need to list every internal ID field unless it impacts the process flow.
🔗 Confusing Message and Sequence Flows
Never use a Message Flow to show control flow within a single pool. Message Flows are reserved for communication between participants. Using them incorrectly breaks the semantic rules of the notation.
📋 Detailed Comparison of Data Specifications
The following table breaks down the specific attributes found in Data Input and Output Specifications within a task definition. Understanding these attributes allows for precise modeling.
| Attribute | Data Input Specification | Data Output Specification |
|---|---|---|
| Direction | Read / Consume | Write / Produce |
| Timing | Before Task Execution | After Task Execution |
| Transformation | May require mapping from source | May require mapping to destination |
| Dependency | Mandatory for start | Result of completion |
By understanding these distinctions, you can build diagrams that accurately reflect the data lifecycle. This precision is especially important when translating a model into executable workflow code.
🔄 Integrating Data into Event-Driven Processes
Processes often begin with events. These events frequently carry data. For example, a “Message Start Event” might trigger when a specific XML payload is received.
- Start Events: Can have data inputs defined. The process cannot start until the data is present.
- Intermediate Events: Can capture data during execution, such as a “Timer Event” that starts after a specific date.
- End Events: Can generate data outputs, such as a “Terminate Event” that saves a final status record.
Visualizing data at the event level ensures that the process boundaries are clear. It defines exactly what information enters the system and what leaves it. This is critical for API design and system integration.
📈 Measuring Data Flow Efficiency
Once your diagram is complete, you can use the visualized data to analyze process efficiency. Look for bottlenecks where data is stuck or duplicated.
- Redundant Inputs: If multiple tasks read the same data object, consider if that data could be cached or passed directly.
- Output Latency: If a task produces data that is not used by the next task immediately, the data sits idle.
- Validation Points: Ensure data validation happens early. If a task produces invalid data, downstream tasks will fail.
By analyzing the data flow, you can optimize the process before it is ever coded. This proactive approach saves significant development time and reduces runtime errors.
🔍 Summary of Implementation Steps
To implement these visualization techniques in your own modeling efforts, follow this structured approach.
- Identify Data Entities: List all documents, records, and variables used in the process.
- Map to Tasks: Assign data objects to specific tasks based on their lifecycle.
- Define Specifications: Mark tasks as Input, Output, or Input/Output.
- Connect Flows: Use data associations to link objects to tasks.
- Review Conditions: Verify that gateways have clear data-based conditions.
- Validate Consistency: Check that names and types match across the entire diagram.
This systematic method ensures that no data requirement is overlooked. It transforms a simple flowchart into a comprehensive specification document.
🤝 Collaboration and Stakeholder Communication
Finally, remember that BPMN is a communication tool. The goal is to ensure that business analysts, developers, and managers all understand the process in the same way.
- Business Stakeholders: Focus on the Data Objects (documents) they recognize.
- Developers: Focus on the Data Specifications and Input/Output mappings.
- Managers: Focus on the Data Stores and where information is retained.
By tailoring the level of data detail to the audience, you ensure the diagram remains useful for everyone involved. Clear visualization bridges the gap between business intent and technical execution.
When you prioritize the visualization of data inputs and outputs, you create models that are robust, accurate, and ready for execution. The process becomes not just a sequence of steps, but a coherent flow of information. This level of detail is what separates a theoretical model from a practical solution.
Adopting these practices requires discipline, but the result is a clearer understanding of how your business actually functions. Every task, decision, and message becomes traceable. This traceability is the foundation of modern process excellence.

