


Data Flow Diagrams (DFDs) are essential tools for systems analysis, providing a clear, visual way to understand how data moves through an information system. By studying real-world examples, you can quickly grasp the core concepts and apply them to your own projects. This guide will walk you through the key concepts of DFDs using examples from the Visual Paradigm repository, explaining the symbols, rules, and thinking behind each diagram.
Understanding the Core Components
Before diving into examples, it’s crucial to understand the four basic building blocks of any DFD :
| Component | Description | Common Notation (Yourdon & Coad) | Common Notation (Gane & Sarson) |
|---|---|---|---|
| External Entity | A person, organization, or system outside the system being modeled that sends or receives data. Examples: Customer, Supplier, Bank. Often called a “source” or “sink.” | Rectangle | Rectangle |
| Process | An activity or function that transforms incoming data into outgoing data. It must have at least one input and one output. Examples: “Verify Payment,” “Ship Order.” | Circle | Rounded Rectangle |
| Data Store | A place where data is held for later use. This could be a database, a file, or even a filing cabinet. | Two Parallel Lines | Open-Ended Rectangle |
| Data Flow | A path for data to move from one part of the system to another. It’s represented by an arrow and shows the direction of movement. | Arrow | Arrow |
Note: There are two main DFD notations, Yourdon & Coad and Gane & Sarson. While their symbols differ slightly, the underlying concepts are identical . It’s important to choose one and be consistent.
The Power of Examples
The examples provided in the Visual Paradigm article are excellent for learning because they show DFDs at different levels of detail. Systems are typically broken down into levels to manage complexity. This is known as leveling .
-
Context Diagram (Level 0): This is the highest-level view. It shows the entire system as a single process and its interactions with all external entities. It provides a simple, big-picture overview . Data stores are NOT shown at this level as they are internal to the system .
-
Level 1 DFD: This diagram “explodes” the single process from the context diagram into its major sub-processes. It shows the primary functions of the system, how data flows between them, and introduces data stores for the first time . A Level 1 DFD must “balance” with the Context Diagram, meaning the data flows entering and leaving the system remain the same.
-
Level 2 DFD (and beyond): These diagrams provide further detail by breaking down one of the processes from the Level 1 diagram. This process continues until the desired level of detail is achieved.
Guided Example: Food Ordering System
Let’s analyze the “Food Ordering System” example referenced in the article to see these concepts in action .
1. Context Diagram (Level 0):
-
External Entities: Likely a Customer and a Kitchen. The customer provides orders and receives food; the kitchen receives orders and confirms their status.
-
Single Process: The entire food ordering system is represented as one process (e.g., “Food Order System”).
-
Data Flows: “Order” (Customer → System), “Food” (System → Customer), “Order Request” (System → Kitchen), “Order Status” (Kitchen → System). This diagram gives you a 10,000-foot view of the system’s scope.
2. Level 1 DFD:
-
This diagram would break down the single process into its main functions. Based on the example, these likely include:
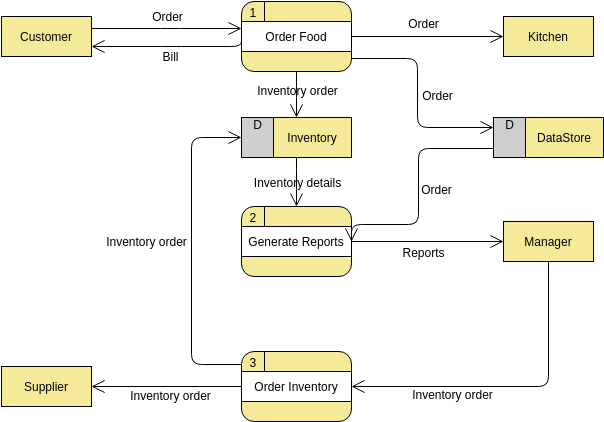
-
1.0 Process Order: Receives the customer’s order, validates it, and forwards it.
-
2.0 Produce Food: Receives the order request and coordinates food preparation.
-
3.0 Manage Payment: Handles the payment process.
-
-
Data Stores: A data store like D1 Order might appear here. Data flows like “Order Details” would move from Process 1.0 to the Order data store, and “Ready-to-Serve Order” would move from Process 2.0 back to Process 1.0 to notify the customer.
By comparing the Context and Level 1 diagrams, you can see how the single, high-level function is decomposed into a set of coordinated sub-processes.
Exploring Other Examples
The article features a range of DFD examples that illustrate different systems and notations :
-
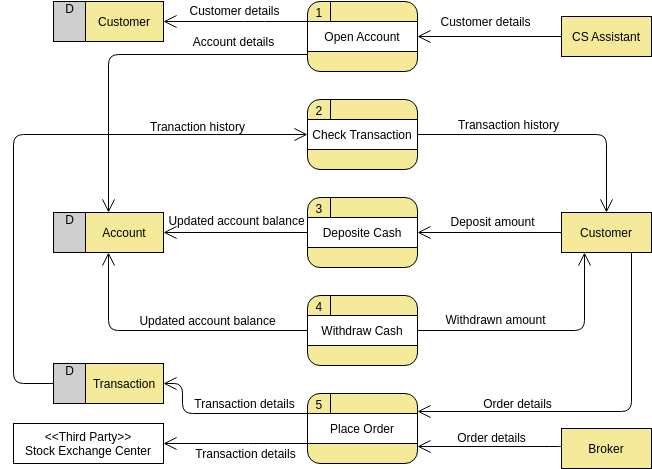
Securities Trading Platform: This example is excellent for understanding complex systems with multiple external entities (e.g., Trader, Stock Exchange) and data stores (e.g., Account Database, Stock Portfolio).
-
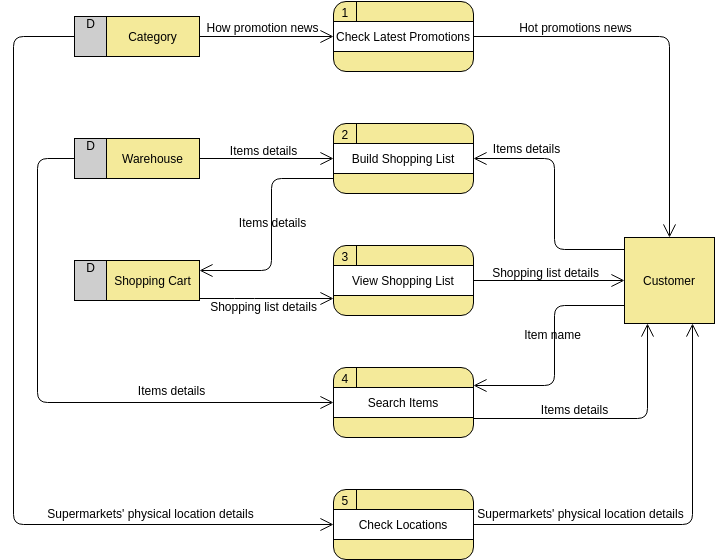
Supermarket App: This example demonstrates how DFDs can be used to model a modern mobile application interacting with backend services like inventory and payment processing.
Key Rules of Thumb
When creating and interpreting DFDs, keep these fundamental rules in mind :
-
Data Cannot Flow Directly:
-
Between two External Entities.
-
Between two Data Stores.
-
Between an External Entity and a Data Store.
Data must always pass through a process .
-
-
Every Process Must Have at Least One Input and One Output Data Flow .
-
Naming Conventions:
-
Processes: Name with strong, active verbs (e.g., “Process Payment,” “Ship Order”).
-
External Entities, Data Stores, and Data Flows: Name with nouns (e.g., “Customer,” “Inventory Database,” “Order Details”) .
-
-
Balance Your Diagrams: The data flows entering and leaving a process on a higher-level diagram must match the combined inputs and outputs of its decomposed sub-processes on a lower-level diagram . This ensures consistency and completeness.
By understanding these core concepts and studying the examples provided in the Visual Paradigm article, you’ll be well-equipped to start creating clear and effective Data Flow Diagrams for your own systems analysis projects.
Reference
-
AI Data Flow Diagram Generator: Effortless Data Flow Modeling with Visual Paradigm: Overview of Visual Paradigm’s AI-powered tool for generating DFDs from text descriptions .
-
AI Gane and Sarson DFD Generator: Effortless Data Flow Modeling: Details on using AI to create Gane and Sarson notation DFDs across Visual Paradigm’s platforms .
-
AI Yourdon DeMarco Diagram Generator: Smarter Data Flow Modeling: Introduction to the AI generator for creating Yourdon DeMarco style data flow diagrams .
-
A Step-by-Step Guide to Creating Data Flow Diagrams with Visual Paradigm: Tutorial covering the basic steps for creating DFDs using Visual Paradigm Online .
-
Mastering Data Flow Diagrams with Visual Paradigm: A Step-by-Step Guide: Guide that uses practical examples like online shopping systems to teach DFD creation .
-
Beginner’s Guide to Data Flow Diagrams (DFD) with Visual Paradigm Online: Introductory guide explaining DFD components and the creation process using templates .
-
Case Study: Streamlining the Food Ordering System with DFD: A practical case study demonstrating the application of DFDs to analyze and optimize a restaurant’s ordering system .
-
Understanding Logical DFD vs. Physical DFD: When and Why We Need Them: Article explaining the differences and appropriate use cases for logical and physical data flow diagrams .
-
Mastering Data Flow Diagram Balancing: A Comprehensive Guide: Guide on the technique of balancing DFDs to ensure consistency across different diagram levels .
-
Understanding Data Flow Diagram (DFD) Levels and Levelling Criteria: Overview of different DFD levels (context, Level 0, Level 1, etc.) and criteria for system decomposition .
-
Top-level DFD: The Power of Context Diagrams: Article focusing on context diagrams as the highest-level DFD representing system boundaries and external interactions .
-
Unlock the Power of Gane Sarson Diagrams with Visual Paradigm’s Online Tool: An overview of using Visual Paradigm to create DFDs using the Gane-Sarson notation .
-
Unveiling Yourdon DeMarco DFD: Streamline Your Diagramming with Visual Paradigm: Guide on creating Yourdon-DeMarco style DFDs with Visual Paradigm’s tools .
-
Beginner’s Guide to SSADM DFD Diagrams with Visual Paradigm Online: Tutorial on creating SSADM-style DFDs using Visual Paradigm Online and its templates .
-
Ensuring Consistency between DFD and ERD: A Comprehensive Guide: Article on maintaining consistency between Data Flow Diagrams and Entity-Relationship Diagrams .
