


🌟 Introduction
In the complex landscape of modern software engineering and business analysis, bridging the communication gap between technical developers and non-technical stakeholders is a perpetual challenge. Enter the Data Flow Diagram (DFD)—a timeless, powerful visual modeling tool that maps out the journey of data through a system.
Unlike flowcharts that focus on control flow and logic loops, DFDs focus strictly on data: where it comes from, how it is transformed, where it is stored, and where it ultimately goes. Whether you are designing a massive e-commerce platform or a simple internal inventory tracker, DFDs provide a bird’s-eye view of your system’s architecture.
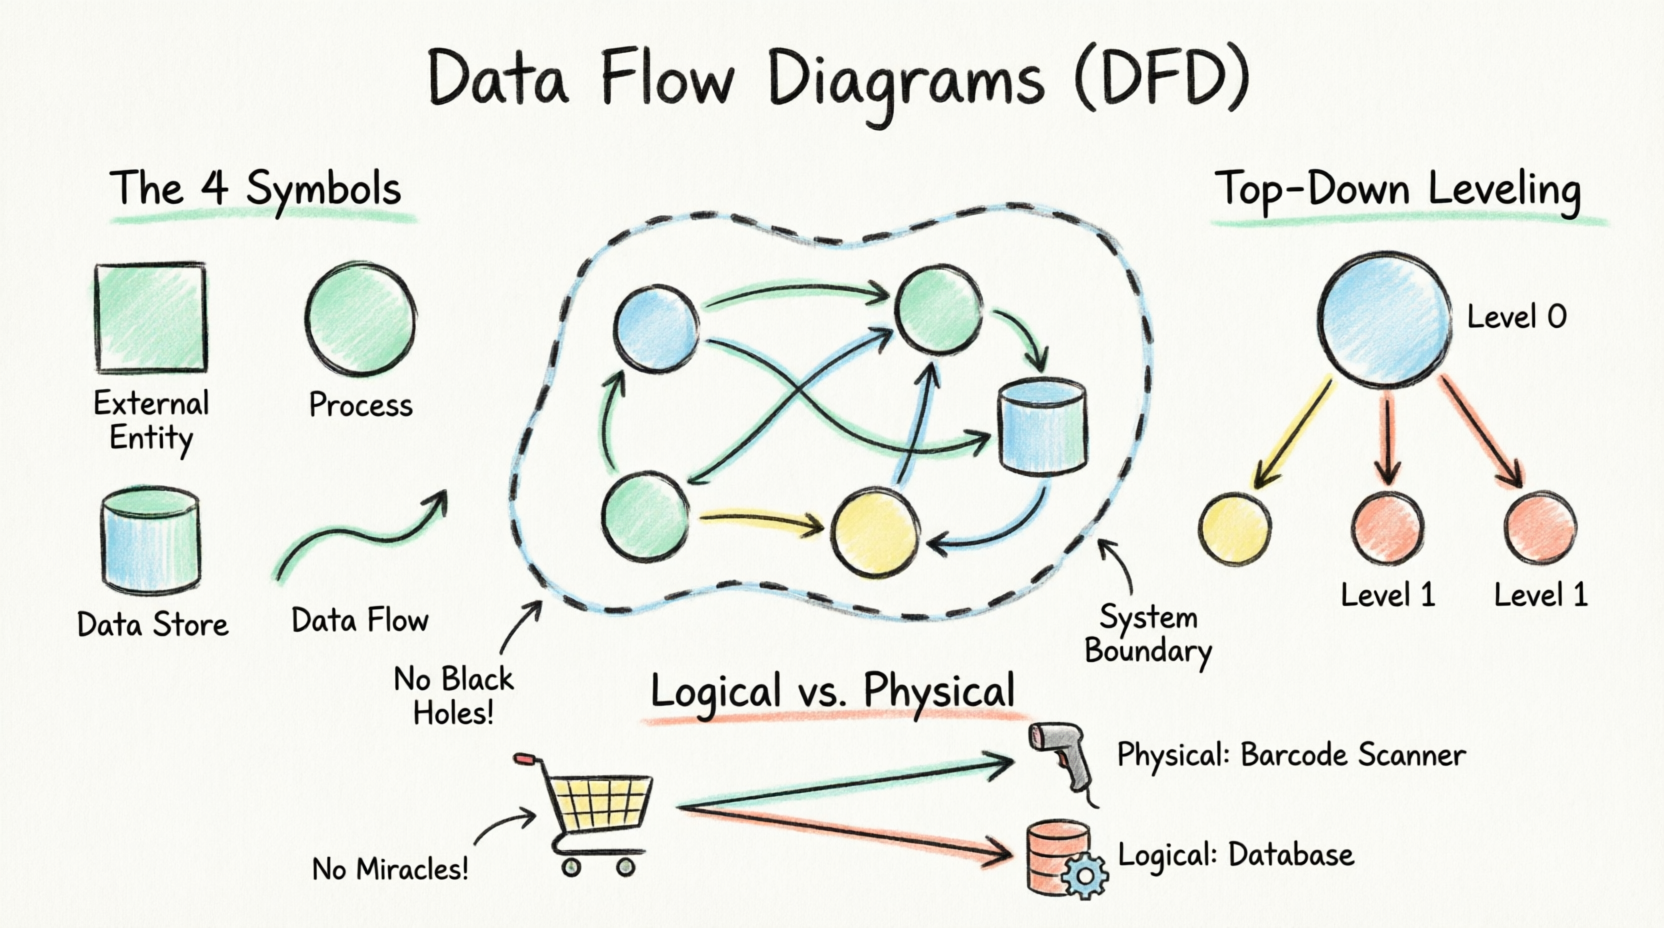
In this comprehensive guide, we will explore the core principles of DFDs, the strict rules that govern them, the differences between logical and physical models, and how to bring these concepts to life using Graphviz DOT code. Every example provided includes a System Boundary Container to clearly delineate internal system processes from external entities.
🧐 What is a Data Flow Diagram (DFD)?
A Data Flow Diagram (DFD) graphically represents the flow of data through a business information system. It maps the processes involved in transferring data from input sources to file storage, and finally to report generation and output destinations.
DFDs are generally divided into two distinct categories:
-
Logical DFD: Describes the business flow of data. It focuses on what the system does (business activities, events, and data generated) without worrying about how it will be technically built.
-
Physical DFD: Describes the implementation of the logical flow. It details how the system will actually be constructed, including specific hardware, software, database files, and manual human interventions.
🎯 Why Use DFDs?
DFDs serve as an exceptional communication tool between users and system designers due to their visual simplicity. They are utilized for:
-
Mapping the logical information flow of the system.
-
Determining physical system construction requirements.
-
Establishing manual vs. automated system requirements.
-
Providing a broad overview that can be expanded into a hierarchy of detailed diagrams.
🧩 The Four Basic Symbols of a DFD
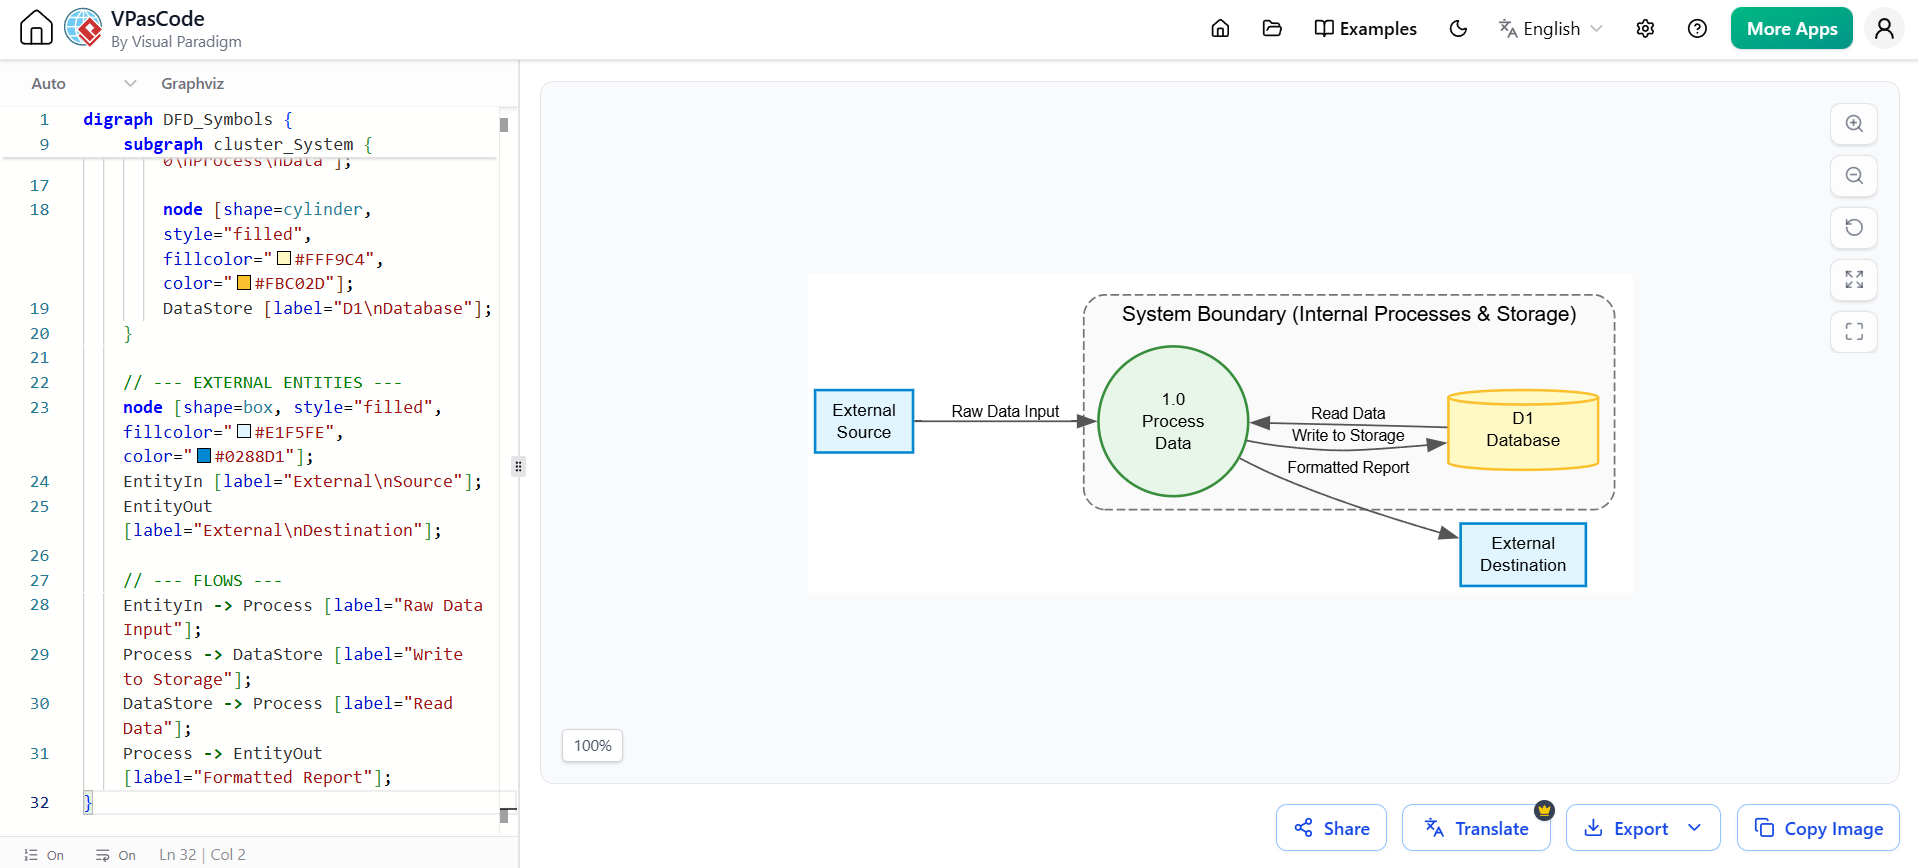
A standard DFD relies on four fundamental building blocks. Below is a Graphviz representation showing how these symbols interact within a defined System Boundary.
digraph DFD_Symbols {
    rankdir=LR;
    splines=true;
    graph [fontname="Helvetica", fontsize=12];
    node [fontname="Helvetica", fontsize=10, penwidth=1.5];
    edge [fontname="Helvetica", fontsize=9, color="#555555"];

    // --- SYSTEM BOUNDARY ---
    subgraph cluster_System {
        label="System Boundary (Internal Processes & Storage)";
        style="dashed,rounded";
        color="#757575";
        bgcolor="#FAFAFA";

        node [shape=circle, style="filled", fillcolor="#E8F5E9", color="#388E3C", width=1.2];
        Process [label="1.0\nProcess\nData"];

        node [shape=cylinder, style="filled", fillcolor="#FFF9C4", color="#FBC02D"];
        DataStore [label="D1\nDatabase"];
    }

    // --- EXTERNAL ENTITIES ---
    node [shape=box, style="filled", fillcolor="#E1F5FE", color="#0288D1"];
    EntityIn [label="External\nSource"];
    EntityOut [label="External\nDestination"];

    // --- FLOWS ---
    EntityIn -> Process [label="Raw Data Input"];
    Process -> DataStore [label="Write to Storage"];
    DataStore -> Process [label="Read Data"];
    Process -> EntityOut [label="Formatted Report"];
}
1. Process
A process receives input data, manipulates it, and produces an output with a different content or form.
-
Notation: A circle (Yourdon-DeMarco) or rounded rectangle (Gane-Sarson). In Graphviz, we use
shape=circle. -
Naming Convention: A verb followed by a singular noun (e.g., Calculate Commission, Verify Order).
-
Rule: Every process must have at least one input data flow and one output data flow.
2. Data Flow
A data flow is the pipeline through which data moves from one component to another. It can represent a single data element or a complex data structure.
-
Notation: A directed line with an arrow (
->in Graphviz). -
Rule: All data flows must begin and end at a processing step, an external entity, or a data store. Data cannot transform on its own.
3. Data Store (Repository)
A data store represents a situation where the system must retain data for later use.
-
Notation: An open-ended rectangle or cylinder. In Graphviz,
shape=cylinderis ideal. -
Rule: A data store must be connected to a process. It requires at least one input flow (writing) and one output flow (reading).
4. External Entity (Terminator)
An external entity is a person, department, outside organization, or external system that provides data to the system or receives outputs from it. They exist outside the system boundaries.
-
Notation: A square/rectangle. In Graphviz,
shape=box. -
Rule: They do not process data; they only originate or consume it.
🚫 Rules of Data Flow & Common Mistakes
When designing DFDs, certain logical rules must be strictly followed to ensure the diagram represents a possible reality.
The “Thumb Rule” of Data Flow
Data cannot move directly between entities, data stores, or from an entity directly to a data store without passing through a Process. Data cannot transform itself.
| ❌ Wrong Flow | ✅ Right Flow | Description |
|---|---|---|
| Entity ➔ Entity | Entity ➔ Process ➔ Entity | An entity cannot provide data to another entity without some processing occurring. |
| Entity ➔ Data Store | Entity ➔ Process ➔ Data Store | Data cannot move directly from an entity to a data store without being processed. |
| Data Store ➔ Data Store | Data Store ➔ Process ➔ Data Store | Data cannot move directly from one data store to another without being processed. |
| Data Store ➔ Entity | Data Store ➔ Process ➔ Entity | Data cannot be sent to an entity directly from a database without a process formatting it. |
Logical Errors (Processing Step Mistakes)
-
⚫ Black Hole: A process has input flows but no output flows. (Data disappears).
-
✨ Miracle: A process has output flows but no input flows. (Data is created out of thin air).
-
⚪ Grey Hole: A process has outputs that are greater than the sum of its inputs. (e.g., Outputting a full user profile when only a User ID was inputted, without reading from a Data Store).
🏗️ Top-Down Decomposition (Leveling)
Top-down decomposition, or leveling, involves starting with a broad overview and expanding into a hierarchy of detailed diagrams. When moving between levels, Balancing must occur: the inputs and outputs of a child diagram must perfectly match the inputs and outputs of the parent process it represents.
Level 0: The Context Diagram
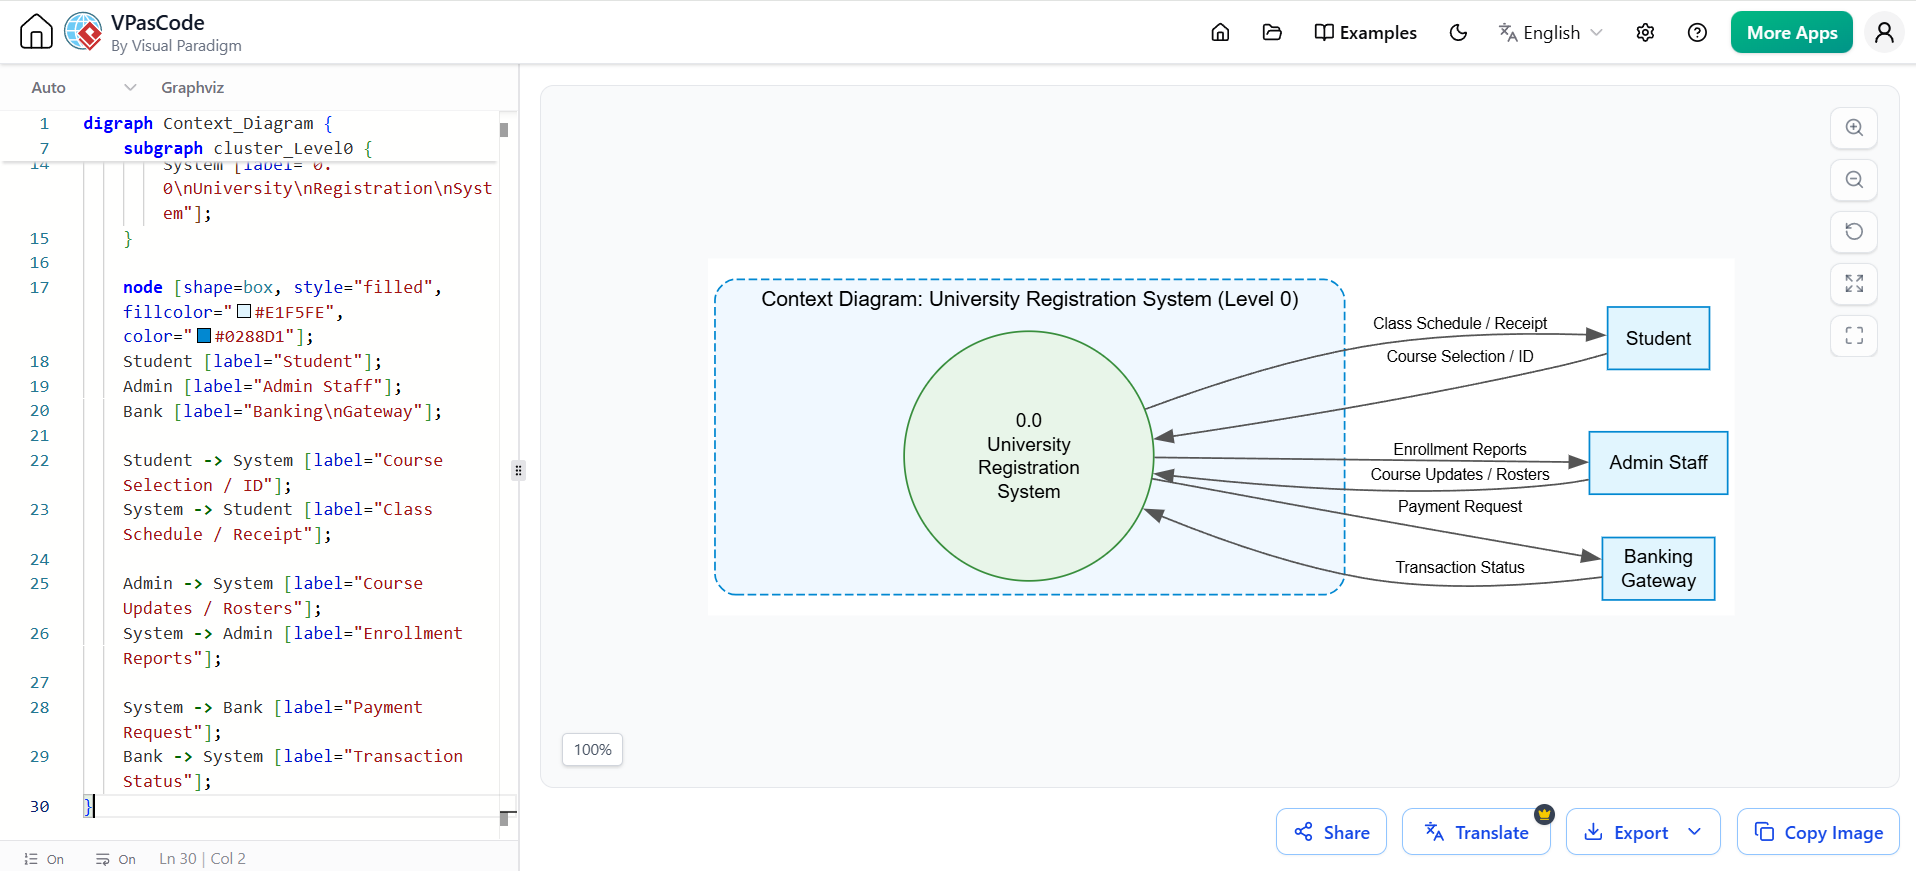
The Context Diagram is the highest level of a DFD. It contains only one single process representing the entire system. It defines the system boundary and how it interacts with the outside world. It does not contain any data stores.
digraph Context_Diagram {
    rankdir=LR;
    graph [fontname="Helvetica", fontsize=12];
    node [fontname="Helvetica", fontsize=11];
    edge [fontname="Helvetica", fontsize=9, color="#555555"];

    subgraph cluster_Level0 {
        label="Context Diagram: University Registration System (Level 0)";
        style="dashed,rounded";
        color="#0288D1";
        bgcolor="#F0F8FF";

        node [shape=circle, style="filled", fillcolor="#E8F5E9", color="#388E3C", width=2.0];
        System [label="0.0\nUniversity\nRegistration\nSystem"];
    }

    node [shape=box, style="filled", fillcolor="#E1F5FE", color="#0288D1"];
    Student [label="Student"];
    Admin [label="Admin Staff"];
    Bank [label="Banking\nGateway"];

    Student -> System [label="Course Selection / ID"];
    System -> Student [label="Class Schedule / Receipt"];

    Admin -> System [label="Course Updates / Rosters"];
    System -> Admin [label="Enrollment Reports"];

    System -> Bank [label="Payment Request"];
    Bank -> System [label="Transaction Status"];
}
Level 1 DFD
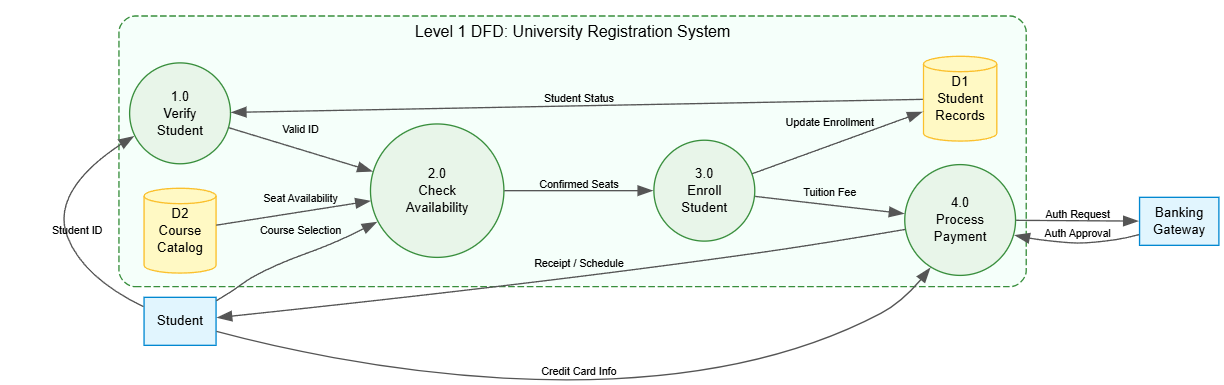
The single process from the Context Diagram is “exploded” to reveal the major internal processes, data stores, and internal data flows. Notice how the external entities and their inputs/outputs remain exactly the same (Balancing).
digraph Level1_DFD {
    rankdir=LR;
    graph [fontname="Helvetica", fontsize=12];
    node [fontname="Helvetica", fontsize=10];
    edge [fontname="Helvetica", fontsize=8, color="#555555"];

    subgraph cluster_Level1 {
        label="Level 1 DFD: University Registration System";
        style="dashed,rounded";
        color="#388E3C";
        bgcolor="#F5FFFA";

        // Processes
        node [shape=circle, style="filled", fillcolor="#E8F5E9", color="#388E3C"];
        P1 [label="1.0\nVerify\nStudent"];
        P2 [label="2.0\nCheck\nAvailability"];
        P3 [label="3.0\nEnroll\nStudent"];
        P4 [label="4.0\nProcess\nPayment"];

        // Data Stores
        node [shape=cylinder, style="filled", fillcolor="#FFF9C4", color="#FBC02D"];
        D1 [label="D1\nStudent\nRecords"];
        D2 [label="D2\nCourse\nCatalog"];
    }

    // External Entities
    node [shape=box, style="filled", fillcolor="#E1F5FE", color="#0288D1"];
    Student [label="Student"];
    Bank [label="Banking\nGateway"];

    // Flows
    Student -> P1 [label="Student ID"];
    D1 -> P1 [label="Student Status"];
    P1 -> P2 [label="Valid ID"];

    Student -> P2 [label="Course Selection"];
    D2 -> P2 [label="Seat Availability"];
    P2 -> P3 [label="Confirmed Seats"];

    P3 -> D1 [label="Update Enrollment"];
    P3 -> P4 [label="Tuition Fee"];

    Student -> P4 [label="Credit Card Info"];
    P4 -> Bank [label="Auth Request"];
    Bank -> P4 [label="Auth Approval"];
    P4 -> Student [label="Receipt / Schedule"];
}
Level 2 DFD
If a process from Level 1 is highly complex, it is extracted and exploded into a Level 2 DFD. This continues until processes reach the “functional primitive” stage (where no further decomposition is necessary).
⚖️ Logical vs. Physical Data Flow Diagrams
While Logical DFDs focus on the business, Physical DFDs focus on the technology and execution.
Benefits of Logical DFDs
-
Stability: Based on business events, making them immune to technological changes.
-
Communication: Easily understood by non-technical project stakeholders.
-
Maintenance: Business functions rarely change as drastically as software architectures.
Benefits of Physical DFDs
-
Technical Clarity: Distinguishes between manual human processes and automated software scripts.
-
Sequencing: Shows strict execution orders (e.g., “Update DB” must happen before “Generate PDF”).
-
Implementation Details: Specifies actual file names, API endpoints, temporary transaction tables, and hardware controls.
🛒 Case Study: Grocery Store Checkout
Below are two diagrams representing the exact same business event, modeled logically and physically.
1. Logical DFD (The Business View)
Focuses on the concepts: Items are totaled, payment is processed, and a receipt is given.
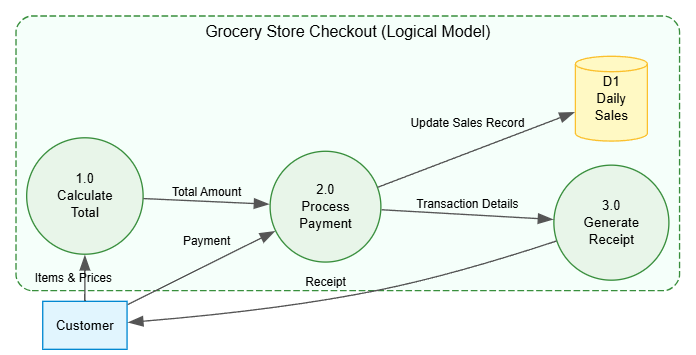
digraph Logical_Grocery {
    rankdir=LR;
    graph [fontname="Helvetica", fontsize=12];
    node [fontname="Helvetica", fontsize=10];
    edge [fontname="Helvetica", fontsize=9, color="#555555"];

    subgraph cluster_LogicalSystem {
        label="Grocery Store Checkout (Logical Model)";
        style="dashed,rounded";
        color="#388E3C";
        bgcolor="#F5FFFA";

        node [shape=circle, style="filled", fillcolor="#E8F5E9", color="#388E3C"];
        P1 [label="1.0\nCalculate\nTotal"];
        P2 [label="2.0\nProcess\nPayment"];
        P3 [label="3.0\nGenerate\nReceipt"];

        node [shape=cylinder, style="filled", fillcolor="#FFF9C4", color="#FBC02D"];
        D1 [label="D1\nDaily\nSales"];
    }

    node [shape=box, style="filled", fillcolor="#E1F5FE", color="#0288D1"];
    Customer [label="Customer"];

    Customer -> P1 [label="Items & Prices"];
    P1 -> P2 [label="Total Amount"];
    Customer -> P2 [label="Payment"];
    P2 -> P3 [label="Transaction Details"];
    P2 -> D1 [label="Update Sales Record"];
    P3 -> Customer [label="Receipt"];
}
2. Physical DFD (The Technical View)
Details the barcode scanner, the UPC database, the temporary session file, and the physical thermal printer.
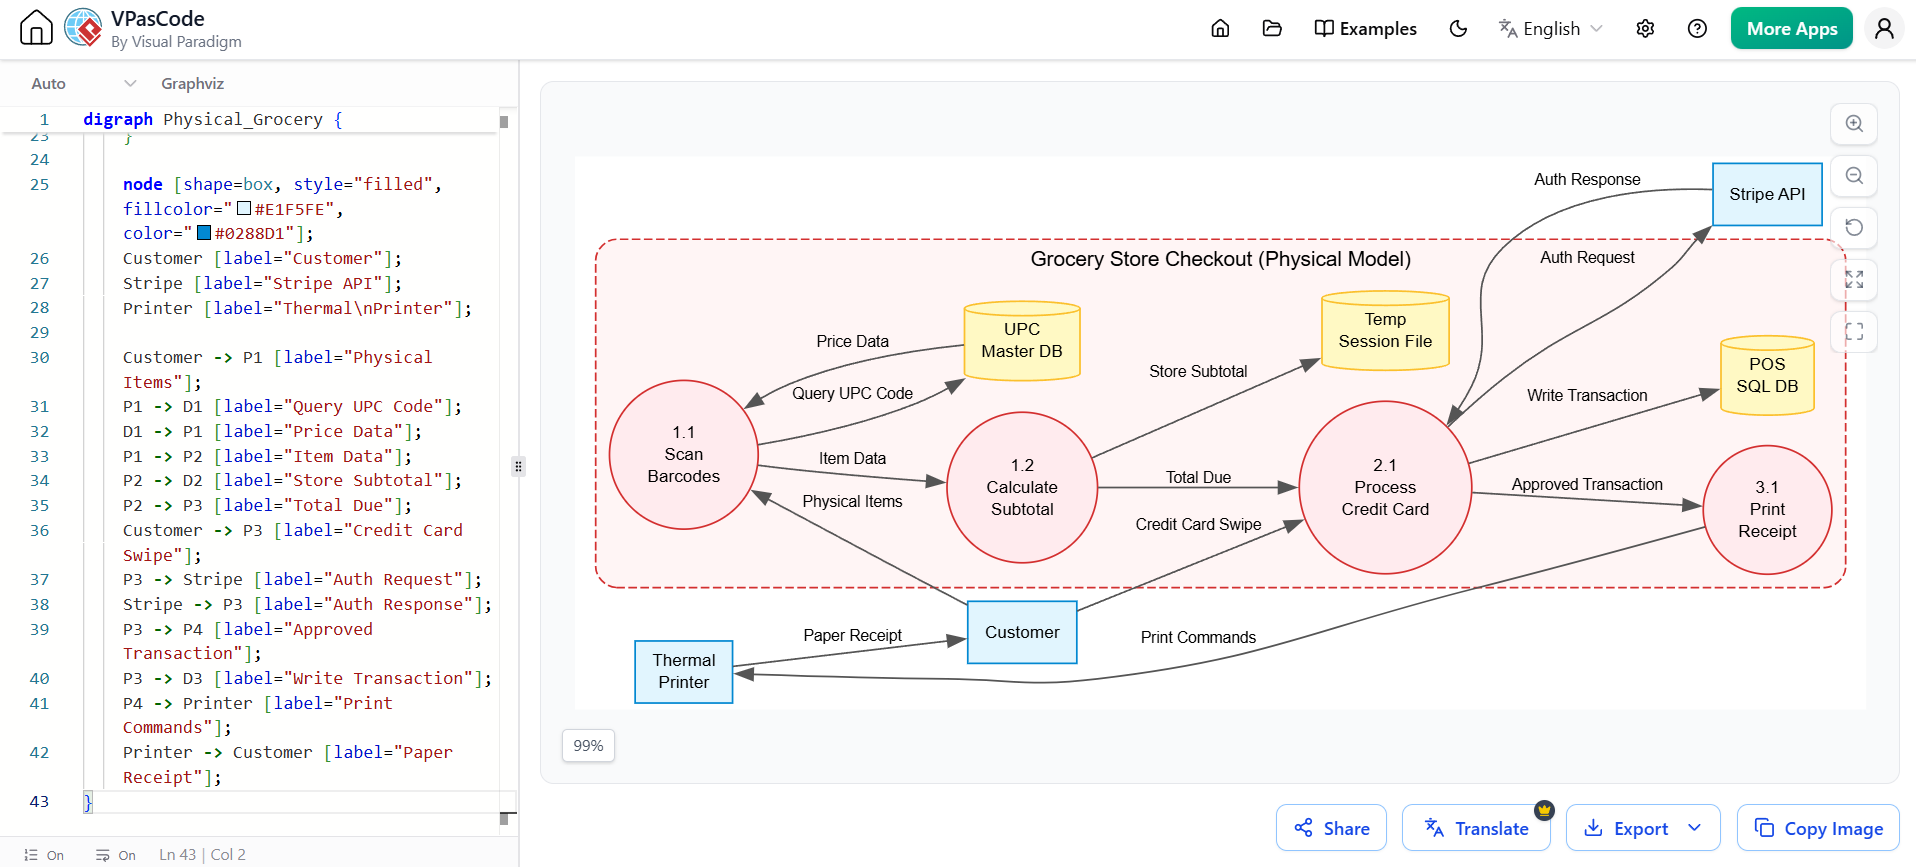
digraph Physical_Grocery {
    rankdir=LR;
    graph [fontname="Helvetica", fontsize=12];
    node [fontname="Helvetica", fontsize=10];
    edge [fontname="Helvetica", fontsize=9, color="#555555"];

    subgraph cluster_PhysicalSystem {
        label="Grocery Store Checkout (Physical Model)";
        style="dashed,rounded";
        color="#D32F2F";
        bgcolor="#FFF5F5";

        node [shape=circle, style="filled", fillcolor="#FFEBEE", color="#D32F2F"];
        P1 [label="1.1\nScan\nBarcodes"];
        P2 [label="1.2\nCalculate\nSubtotal"];
        P3 [label="2.1\nProcess\nCredit Card"];
        P4 [label="3.1\nPrint\nReceipt"];

        node [shape=cylinder, style="filled", fillcolor="#FFF9C4", color="#FBC02D"];
        D1 [label="UPC\nMaster DB"];
        D2 [label="Temp\nSession File"];
        D3 [label="POS\nSQL DB"];
    }

    node [shape=box, style="filled", fillcolor="#E1F5FE", color="#0288D1"];
    Customer [label="Customer"];
    Stripe [label="Stripe API"];
    Printer [label="Thermal\nPrinter"];

    Customer -> P1 [label="Physical Items"];
    P1 -> D1 [label="Query UPC Code"];
    D1 -> P1 [label="Price Data"];
    P1 -> P2 [label="Item Data"];
    P2 -> D2 [label="Store Subtotal"];
    P2 -> P3 [label="Total Due"];
    Customer -> P3 [label="Credit Card Swipe"];
    P3 -> Stripe [label="Auth Request"];
    Stripe -> P3 [label="Auth Response"];
    P3 -> P4 [label="Approved Transaction"];
    P3 -> D3 [label="Write Transaction"];
    P4 -> Printer [label="Print Commands"];
    Printer -> Customer [label="Paper Receipt"];
}
📏 Guidelines for Developing Flawless DFDs
To ensure your diagrams remain readable and logically sound, adhere to these industry-standard guidelines:
-
The Context Diagram Rule: The Level 0 diagram must fit on a single page. The single process should be named after the entire system (e.g., Order Processing System).
-
Unique Names: Use unique names within each set of symbols across all levels. There can only be one entity named
CUSTOMERacross the entire DFD hierarchy. -
No Crossing Lines: Avoid crossing data flow lines. If a diagram becomes too complex, restrict the number of processes or use duplicate symbols (like a duplicated External Entity) marked with an asterisk (*) to keep routing clean.
-
The 7 ± 2 Rule: The human mind can comfortably process between 5 and 9 items at once. A single DFD page should not contain more than 7 to 9 process symbols. If it does, decompose it further.
-
Numbering Convention: Use hierarchical reference numbers for processes.
-
Level 0:
0 -
Level 1:
1.0,2.0,3.0 -
Level 2:
1.1,1.2,2.1,2.2 -
Level 3:
1.1.1,1.1.2
-
🏁 Conclusion
Data Flow Diagrams remain one of the most effective methodologies for visualizing system architecture, defining requirements, and aligning business goals with technical execution. By strictly adhering to DFD rules—avoiding black holes, ensuring balanced leveling, and distinguishing between logical intent and physical implementation—teams can prevent costly architectural flaws before a single line of code is written.
Furthermore, by utilizing declarative diagramming tools like Graphviz DOT, engineering teams can treat their DFDs as code. This allows system architecture to be version-controlled, peer-reviewed, and automatically generated alongside the software itself, ensuring that documentation never falls out of sync with the actual system boundary. Whether you are mapping a simple grocery checkout or a global e-commerce network, the principles of the DFD provide a clear, undeniable map of your data’s journey.
Reference
-
AI Gane and Sarson DFD Generator by Visual Paradigm: Explains how Visual Paradigm’s AI tools can generate Gane-Sarson DFDs from text descriptions.
-
A Step-by-Step Guide to Creating Data Flow Diagrams with Visual Paradigm: Provides a tutorial for creating DFDs with the Visual Paradigm online tool, from registration to sharing.
-
How to Create Data Flow Diagram (DFD)?: A guide covering what a DFD is, its purpose, and the main types (Physical and Logical).
-
Beginners Guide to SSADM DFD Diagrams with Visual Paradigm Online: An introductory guide to creating SSADM-style data flow diagrams using Visual Paradigm Online.
-
Comprehensive Guide to Data Flow Diagrams (DFD): Demystifying Information Flow: An overview of DFDs, detailing their elements and why Visual Paradigm is a suitable tool for creating them.
-
Mastering Data Flow Diagrams with Visual Paradigm: A Step-by-Step Guide: A practical guide that uses examples and templates to teach DFD creation, featuring case studies like online shopping systems.
-
Understanding Logical DFD vs. Physical DFD: When and Why We Need Them: Explains the differences, purposes, and appropriate use cases for logical and physical data flow diagrams.
-
Beginners Guide to Data Flow Diagrams (DFD) with Visual Paradigm Online: A beginner-friendly tutorial that walks through the steps of creating a DFD with Visual Paradigm Online.
-
DFD Archives – Visual Paradigm Guides: A collection of articles on DFD topics including AI generators, validation, balancing, and levels.
-
Getting Started Guide to Data Flow Diagrams (DFD) with Visual Paradigm Online: Details the step-by-step process of creating DFDs, including its key components and how to use templates.
-
Draw DFD with the Best DFD tool: Discusses the graphic representation of data flow, details the logic vs. physical DFDs, and explores the benefits of each type.
-
Panduan Pemula untuk Diagram Aliran Data (DFD) dengan Visual Paradigm Online: An Indonesian-language beginner’s guide to DFDs, outlining components and the step-by-step creation process in Visual Paradigm Online.
Related posts:
 Mastering UML Deployment Diagrams with Visual Paradigm: From Manual Design to AI Generation
A Comprehensive Guide to the Visual Paradigm AI Assistant for TOGAF ADM: Streamlining Enterprise Architecture with Generative Intelligence
Transforming Enterprise Architecture with Generative AI: A Comprehensive Guide to Intelligent TOGAF ADM Execution
A Comprehensive Guide to AI-Powered UML Diagram Generation in Visual Paradigm
Mastering UML Deployment Diagrams with Visual Paradigm: From Manual Design to AI Generation
A Comprehensive Guide to the Visual Paradigm AI Assistant for TOGAF ADM: Streamlining Enterprise Architecture with Generative Intelligence
Transforming Enterprise Architecture with Generative AI: A Comprehensive Guide to Intelligent TOGAF ADM Execution
A Comprehensive Guide to AI-Powered UML Diagram Generation in Visual Paradigm