


In the complex landscape of modern business operations, the ability to quantify the value of change is critical. When organizations adopt Business Process Model and Notation (BPMN) to map, analyze, and redesign workflows, the expectation is efficiency. However, without a rigorous calculation of Return on Investment (ROI), these initiatives risk becoming exercises in documentation rather than drivers of financial performance. This guide provides a detailed, authoritative framework for measuring the economic impact of BPMN process improvement projects.
ROI calculation in the context of process management is not merely about subtracting costs from revenue. It requires a deep understanding of resource allocation, time-to-value, and the intangible benefits of standardization. By following the methodology outlined below, stakeholders can make informed decisions about where to direct their capital and labor.
🔍 Establishing the Baseline: The As-Is State
Before projecting future gains, one must accurately capture the current operational reality. The As-Is model serves as the control group for all subsequent financial analysis. Skipping this step often leads to inflated benefit estimates.
- Time Tracking: Measure the duration of each task within the process. Use historical data where possible, supplemented by employee time logs if real-time data is unavailable.
- Resource Consumption: Identify the specific roles involved. Calculate the fully burdened labor cost (salary, benefits, overhead) for each role participating in the workflow.
- Cost Per Transaction: Divide the total cost of the process by the volume of transactions. This metric provides a per-unit baseline for comparison.
- Error Rates: Document the frequency of rework, exceptions, and compliance violations. These errors carry a direct cost in terms of labor and potential penalties.
Accurate baseline data prevents the common pitfall of assuming current inefficiencies are lower than they actually are. If the current state is poorly understood, the “improvement” appears larger than it truly is.
🎯 Defining the Target State: The To-Be Model
The To-Be model represents the optimized workflow. It is the blueprint for the new state of operations. The ROI calculation depends heavily on the realism of this model. Over-optimistic To-Be assumptions will skew the financial analysis negatively.
- Automation Potential: Identify manual steps that can be automated. Automation reduces labor hours but may introduce maintenance costs for the underlying logic.
- Parallel Processing: Determine if sequential tasks can be performed simultaneously. This reduces the overall cycle time, allowing for higher throughput.
- Exception Handling: Redesign the path for exceptions. A robust process minimizes the need for manual intervention in edge cases.
- Compliance Integration: Ensure the new model inherently satisfies regulatory requirements, reducing the audit burden.
💰 Identifying Implementation Costs
Investment is not limited to software licensing. In a BPMN initiative, the majority of costs often stem from human capital and organizational change.
| Cost Category | Description | Estimation Method |
|---|---|---|
| Analysis & Design | Time spent by business analysts and process owners mapping the current and future states. | Hours × Hourly Rate |
| Technology Stack | Costs associated with modeling tools, execution engines, or integration middleware. | Licensing + Implementation Fees |
| Training | Education for staff on new workflows and tools. Includes material development and lost productivity during sessions. | Trainer Fees + Employee Hours |
| Change Management | Communication, resistance mitigation, and cultural adjustments required to sustain the change. | Consulting Fees + Internal Resources |
| Testing & Validation | Quality assurance activities to ensure the new process functions correctly before full rollout. | QA Team Hours + Tools |
| Maintenance | Ongoing costs for updating models, managing exceptions, and system upkeep post-launch. | Annual % of Initial Cost |
It is essential to capture hidden costs. For instance, the time required to migrate historical data to a new process structure is often overlooked. Similarly, the cost of downtime during the transition period must be factored into the total investment.
📈 Quantifying Benefits: Hard vs. Soft
Benefits fall into two distinct categories: hard savings (direct financial impact) and soft savings (indirect or qualitative improvements). Both are necessary for a complete ROI picture.
Hard Savings
- Labor Reduction: The most direct metric. Calculate the hours saved per transaction and multiply by the labor rate. For example, reducing a 10-minute approval step to 2 minutes saves 8 minutes per instance.
- Material Costs: Process improvements often reduce waste. Fewer errors mean fewer wasted materials or reprinted documents.
- Inventory Reduction: Faster processes can reduce the need for safety stock in supply chain scenarios.
- Compliance Fines Avoided: If the process improvement reduces regulatory risk, calculate the expected value of avoided penalties based on historical risk exposure.
Soft Savings
While harder to quantify, soft savings significantly influence long-term viability.
- Employee Satisfaction: Streamlined processes reduce frustration. This can lower turnover rates and recruitment costs.
- Cycle Time: Faster delivery to customers improves market responsiveness and competitive advantage.
- Data Quality: Standardized data entry leads to better reporting and decision-making capabilities.
- Scalability: A robust process can handle increased volume without proportional increases in headcount.
When calculating ROI, assign a monetary value to soft savings where possible. For example, estimate the cost of turnover reduction if process clarity improves retention by 5%.
🧮 The ROI Calculation Framework
The core formula for Return on Investment is straightforward, but the inputs require precision.
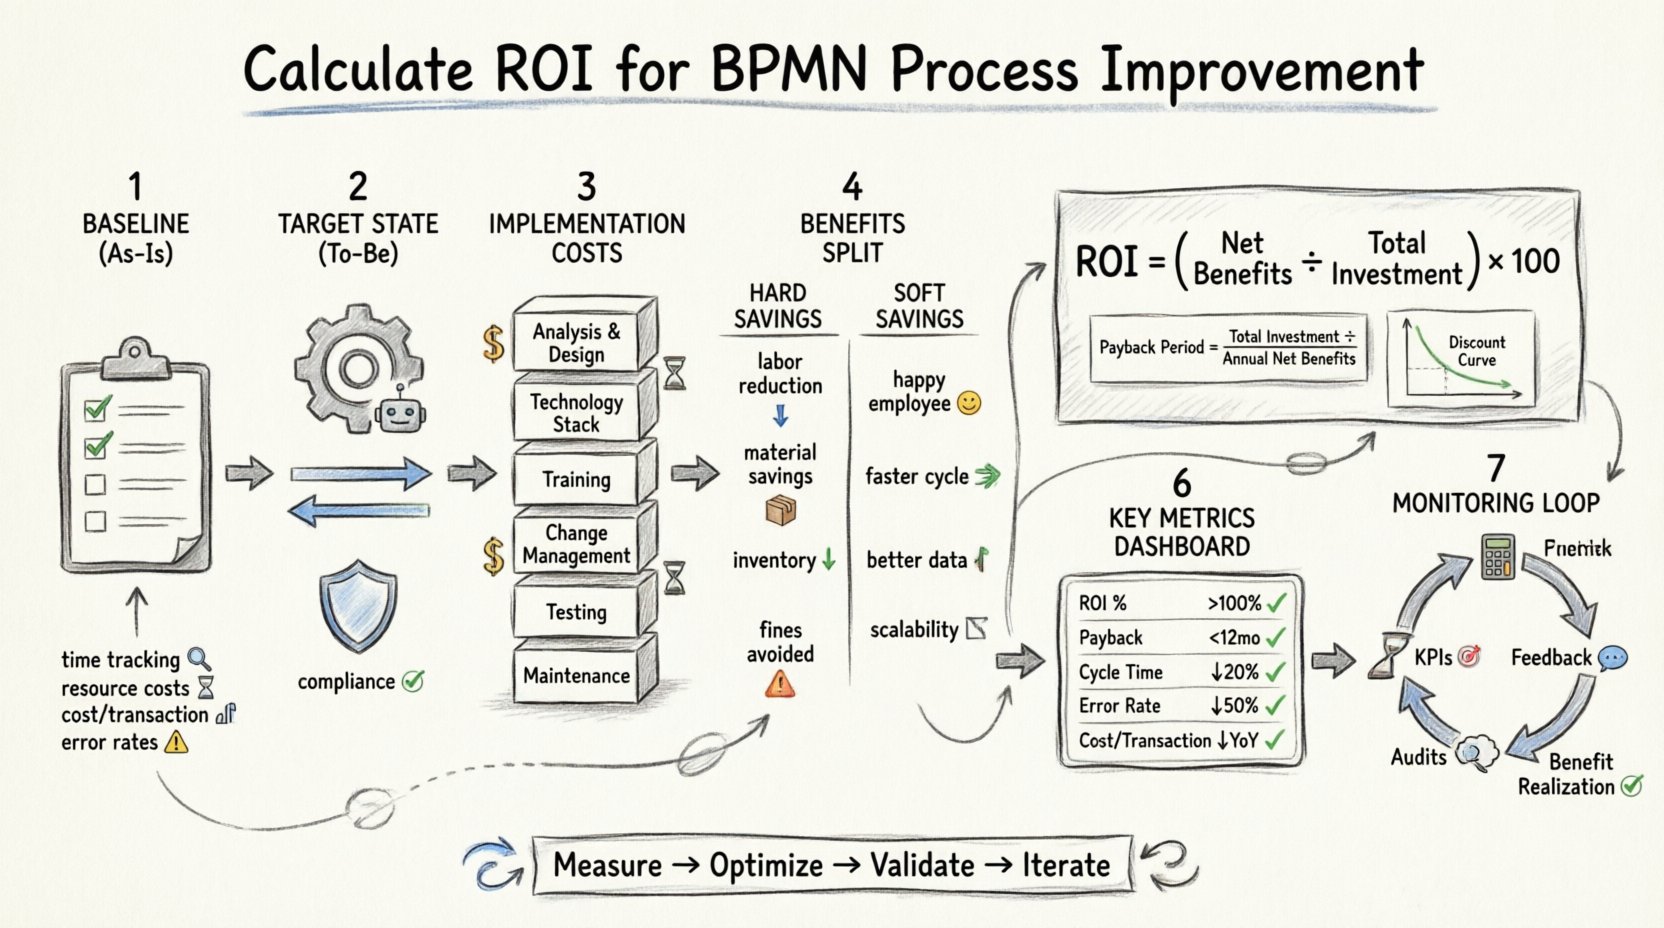
ROI = (Net Benefits / Total Investment) × 100
Net Benefits are calculated as Total Benefits minus Total Investment. The result is expressed as a percentage. A positive ROI indicates that the project generates more value than it costs.
Payback Period
While ROI gives a percentage, the Payback Period tells you how long it takes to recover the initial investment. This is crucial for cash-flow management.
- Formula: Total Investment / Monthly Net Cash Flow.
- Interpretation: If the investment is $100,000 and monthly savings are $10,000, the payback period is 10 months.
Net Present Value (NPV)
For long-term projects, time value of money matters. NPV discounts future cash flows to their present value. This prevents overvaluing savings that will occur years in the future.
- Discount Rate: Use the organization’s cost of capital or hurdle rate.
- Time Horizon: Typically 3 to 5 years for process improvement initiatives.
Using NPV alongside ROI provides a more robust financial view, especially when comparing multiple competing initiatives.
⚠️ Common Pitfalls in Calculation
Even with a solid formula, errors in execution can lead to misleading results. Awareness of these pitfalls is essential for accuracy.
- Ignoring Hidden Costs: Focusing only on direct savings while neglecting training or maintenance costs inflates the ROI.
- Overestimating Adoption: Assuming 100% compliance with the new process is unrealistic. Factor in a transition period where adoption is partial.
- Double Counting: Ensure benefits are not counted in multiple categories. For example, do not count both reduced labor and reduced material costs if the material cost reduction is a direct result of the labor efficiency.
- Static Assumptions: Processes exist in dynamic environments. Assume that volume and rates will change. Use sensitivity analysis to test best-case and worst-case scenarios.
- Focus on Tools, Not Processes: Implementing technology without changing the underlying process logic often leads to “automating waste.” The ROI calculation must reflect process change, not just tool adoption.
📉 Risk Analysis and Sensitivity Testing
Every business initiative carries risk. A thorough ROI analysis includes a risk assessment to understand the probability of failure.
- Operational Risk: What if the new process causes delays during implementation?
- Financial Risk: What if the cost of the project exceeds the budget?
- Strategic Risk: What if the process improvement does not align with long-term goals?
Sensitivity testing involves changing one variable at a time to see the impact on the final ROI. For instance, if labor costs decrease by 10% due to market conditions, how does that affect the payback period? This analysis helps stakeholders understand the resilience of the investment.
🔄 Post-Implementation Monitoring
The calculation does not end at launch. Continuous monitoring ensures the projected ROI is actually realized.
- Key Performance Indicators (KPIs): Define specific metrics to track. Examples include Process Cycle Time, Cost Per Transaction, and Error Rate.
- Feedback Loops: Establish channels for users to report issues. This helps identify gaps between the designed model and actual execution.
- Periodic Audits: Review the process annually to ensure it remains aligned with business goals. Processes can drift over time.
- Benefit Realization: Compare actual savings against projected savings. If there is a variance, investigate the root cause.
This phase turns the ROI calculation into a living metric. It validates the initial hypothesis and provides data for future improvement cycles.
📋 Summary of Key Metrics
For quick reference, here are the essential metrics to include in any BPMN ROI report.
| Metric | Definition | Target |
|---|---|---|
| ROI Percentage | Net profit relative to cost | > 100% in Year 1 |
| Payback Period | Time to recover investment | < 12 Months |
| Cycle Time Reduction | Percentage decrease in duration | > 20% |
| Error Rate Reduction | Percentage decrease in defects | > 50% |
| Cost Per Transaction | Total cost divided by volume | Decrease YoY |
These metrics provide a standardized way to communicate value across the organization. They align technical process changes with financial objectives.
🚀 Moving Forward with Confidence
Calculating ROI for BPMN initiatives is a discipline that blends finance, operations, and data analysis. It requires rigor, honesty, and a willingness to challenge assumptions. By adhering to the steps outlined in this guide, organizations can ensure that their process improvement efforts deliver tangible value.
The goal is not just to improve processes, but to improve the business. A well-calculated ROI provides the justification needed to secure resources, gain stakeholder buy-in, and drive sustainable growth. When the numbers align with the strategy, the path forward becomes clear.
Remember that process improvement is iterative. The initial calculation is a hypothesis. The post-implementation data validates or refutes it. This cycle of measurement and adjustment is the core of effective business process management.
By focusing on accurate baselines, comprehensive cost identification, and realistic benefit quantification, you build a foundation for success. Avoid the temptation to oversell the potential. Under-promise and over-deliver is a safer strategy for long-term credibility.
Finally, involve the right people. Finance, operations, and IT must collaborate on these calculations. Siloed data leads to siloed insights. A cross-functional approach ensures that all cost drivers and benefit levers are accounted for.
With this framework in place, your organization is equipped to navigate the complexities of process transformation. The numbers will tell the story, and that story will drive your next strategic move.

