


In the landscape of software architecture and system design, clarity is paramount. When modeling complex systems, professionals often encounter a choice between various Unified Modeling Language (UML) diagrams. Two specific types often cause confusion due to their overlapping contexts: the Profile Diagram and the Sequence Diagram. While both play critical roles in defining how a system functions, they serve fundamentally different purposes. One defines the structural language of the system, while the other defines the dynamic behavior over time.
This guide provides a deep dive into these two modeling artifacts. We will explore their definitions, technical syntax, practical applications, and how they integrate to form a cohesive design strategy. Whether you are a system architect, a developer, or a technical analyst, understanding the distinction ensures your models remain accurate and maintainable.
📐 Understanding the Profile Diagram
The Profile Diagram is a specialized UML 2.0 artifact designed to extend the standard modeling language. It does not describe the runtime behavior of a system directly. Instead, it defines a custom vocabulary for that system. In large-scale enterprise environments, the standard UML metamodel often lacks the specific terminology required for a particular domain. The Profile Diagram allows architects to create stereotypes, tagged values, and constraints that apply to existing UML elements.
Core Components of a Profile
To understand the Profile Diagram, one must understand its building blocks. These components allow you to tailor the modeling language to your specific organizational standards.
- Stereotypes: These are extensions of existing UML metaclasses. For example, a standard Class can be extended to become a <<Service>> or a <<Database>>. This adds semantic meaning without changing the underlying structure.
- Tagged Values: These are key-value pairs attached to elements. They allow for additional metadata, such as a "priority" level for a task or a "version" number for a component.
- Constraints: These define specific rules or restrictions on elements. For instance, a constraint might specify that a specific type of entity must never be modified after deployment.
- Profile Package: The container that holds all these extensions. It is the root unit of a profile.
Why Use a Profile Diagram?
Why not just use standard UML? In complex ecosystems, standard UML can be too generic. A Profile Diagram offers several advantages:
- Standardization: It ensures all teams use the same terminology. If everyone agrees on what <<Microservice>> means, documentation remains consistent.
- Tool Support: Modeling tools can read these profiles to provide specific validation or code generation capabilities tailored to your architecture.
- Clarity: It reduces ambiguity. A generic "Class" does not tell you if it is a UI component or a business logic unit. A Profile clarifies this immediately.
Technical Structure
Technically, a Profile Diagram is often represented as a package diagram containing the profile definition. It includes the profile name, the extension mechanism, and the specific classifiers being extended. It is a static definition. It describes what the system can be, not what it does.
⏱️ Understanding the Sequence Diagram
If the Profile Diagram defines the language, the Sequence Diagram defines the conversation. It is a behavioral diagram that illustrates how objects interact with one another over a period of time. It is one of the most widely used diagrams in software development because it maps directly to the flow of logic and data exchange.
Key Elements of a Sequence Diagram
A Sequence Diagram is built around the concept of time and interaction. The visual layout typically flows from top to bottom, representing the passage of time.
- Lifelines: Represented by vertical dashed lines, these represent individual instances of objects or actors. They show the existence of an entity throughout the interaction.
- Activation Bars: Thin rectangles on the lifeline indicating when an object is performing an action or is actively processing a message.
- Messages: Arrows connecting lifelines. These represent calls, signals, or returns. They can be synchronous (blocking) or asynchronous (non-blocking).
- Return Messages: Often shown as dashed lines, these indicate the response to a previous message.
- Combined Fragments: Boxes that group multiple messages under specific logic conditions.
Advanced Interaction Types
Sequence diagrams are not just simple arrows. They support complex logic structures:
- Alt (Alternative): Used to show branching logic, such as an
if-elsestatement. Only one path is taken based on a condition. - Opt (Optional): Indicates a message that may or may not occur, often controlled by a boolean flag.
- Loop: Represents iterative behavior, such as a
fororwhileloop. - Par (Parallel): Shows concurrent execution paths where multiple messages happen simultaneously.
- Critical: Indicates a section of code that must be executed atomically, often involving resource locking.
Why Use a Sequence Diagram?
Developers rely on Sequence Diagrams for:
- API Documentation: They clearly show request and response structures between services.
- Debugging: They help trace the flow of execution when a bug occurs.
- Testing: They serve as a blueprint for writing integration tests.
- Communication: They are excellent for discussing logic with stakeholders who understand flow charts better than class structures.
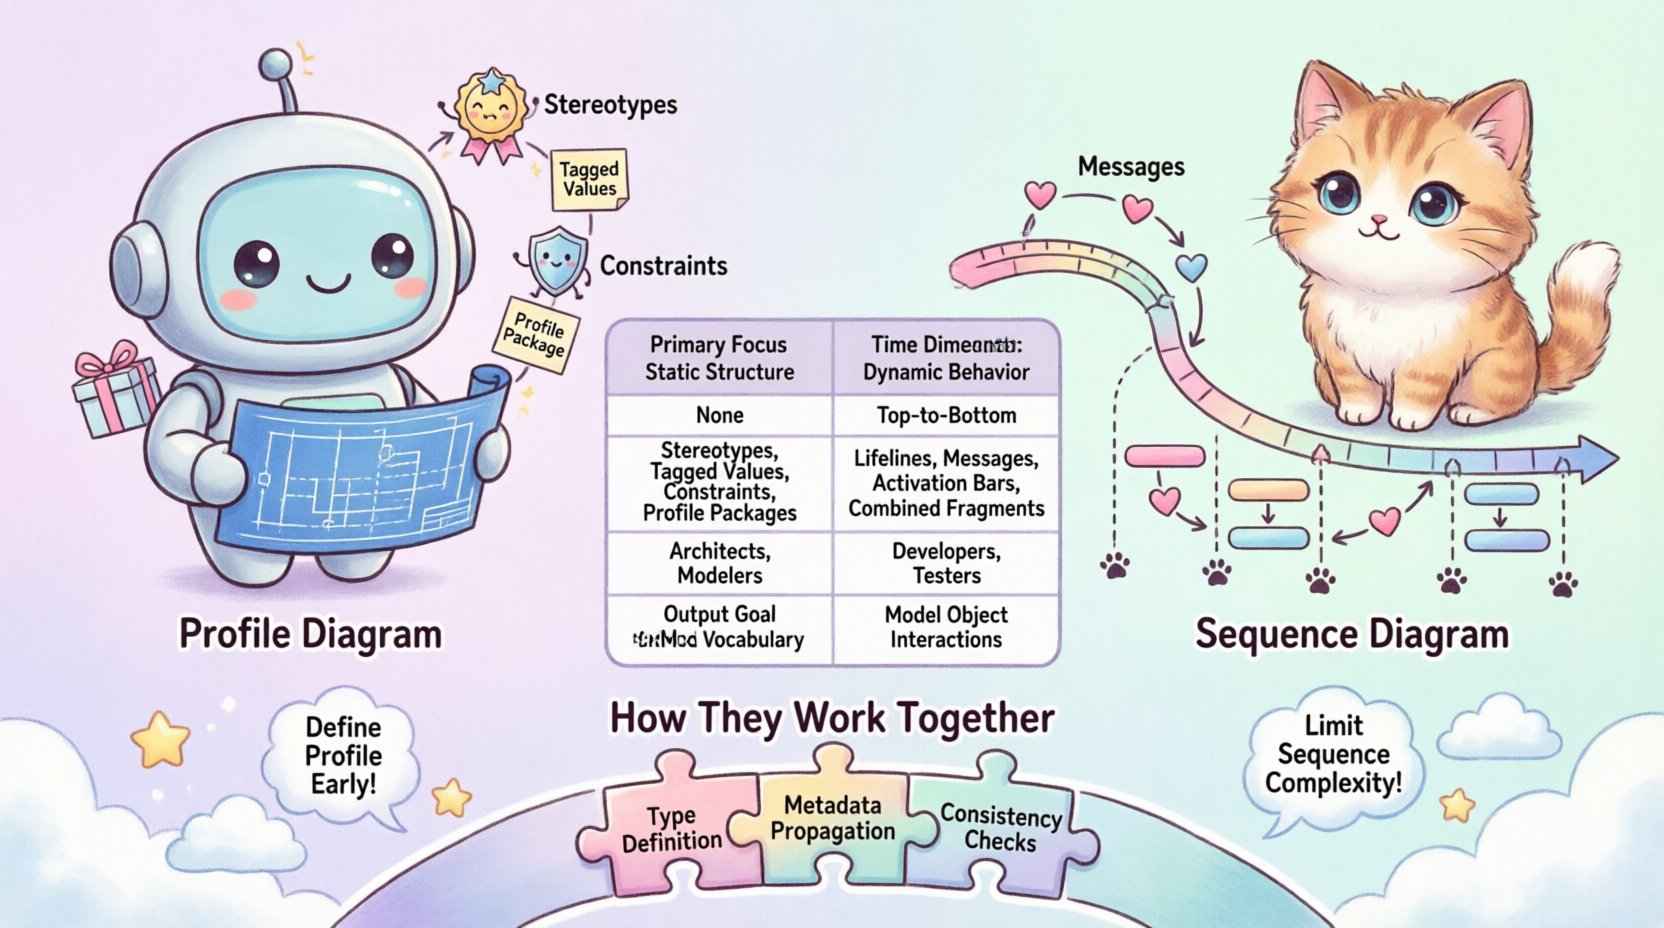
🆚 Core Differences at a Glance
While both diagrams belong to the UML family, their intent and application differ significantly. The following table outlines the primary distinctions.
| Feature | Profile Diagram | Sequence Diagram |
|---|---|---|
| Primary Focus | Static Structure & Metamodel Extension | Dynamic Behavior & Interaction |
| Time Dimension | None (Static Definition) | Explicit (Top to Bottom Flow) |
| Key Elements | Stereotypes, Tagged Values, Constraints | Lifelines, Messages, Activation Bars |
| Typical Audience | Architects, Tool Developers, Modelers | Developers, Testers, Product Owners |
| Output Goal | Standardized Vocabulary | Runtime Behavior Logic |
| Complexity Driver | Number of Extensions | Number of Interactions |
🤝 How They Work Together
It is a common misconception that these diagrams are mutually exclusive. In a robust modeling strategy, they complement each other. A Profile Diagram often defines the types used within a Sequence Diagram.
Integration Pattern 1: Type Definition
Before drawing a Sequence Diagram, you might define a custom Profile. For example, you might define a stereotype <<APIEndpoint>>. When you later create a Sequence Diagram to model a user login flow, you apply this stereotype to the relevant object lifeline. This tells the reader immediately that this lifeline represents a specific type of endpoint, not just a generic class.
Integration Pattern 2: Metadata Propagation
Tagged values defined in the Profile can be inherited by elements in the Sequence Diagram. If your Profile defines a tagged value called "SecurityLevel", you can attach this to objects in your Sequence Diagram. This allows you to visualize not just the flow, but the security constraints attached to that flow.
Integration Pattern 3: Consistency Checks
Modeling tools can use the Profile to validate the Sequence Diagram. If a Sequence Diagram uses a message type that is not defined in the active Profile, the tool can flag a potential inconsistency. This ensures that the dynamic behavior adheres to the static constraints established by the architecture team.
🛠️ Implementation Strategies
When implementing these diagrams in a project, you need a strategy. Ad-hoc modeling often leads to technical debt. Here are strategies for effective implementation.
1. Define the Profile Early
Do not wait until you are drawing sequences to define your profiles. Create the Profile Diagram during the initial architectural phase. Establish the standard stereotypes for your domain (e.g., <<Entity>>, <<DTO>>, <<Controller>>). This upfront work saves time later when you are refining the sequence flows.
2. Limit Sequence Complexity
Sequence diagrams can become messy quickly. A single diagram should ideally focus on one specific scenario or use case. If you find yourself needing multiple scenarios, split them into separate diagrams. Use Combined Fragments to manage logic, but avoid nesting them too deeply, as this reduces readability.
3. Reuse Profile Extensions
Profiles should be modular. Instead of creating a new profile for every subsystem, create a core profile that defines general extensions. Subsystems can extend the core profile further if needed. This hierarchical approach keeps the metamodel manageable.
4. Link Diagrams Explicitly
When documenting a system, ensure links exist between the Profile and the Sequence diagrams. A reference in the Sequence diagram should point to the Profile definition for specific types. This creates a traceable lineage from the abstract definition to the concrete interaction.
⚠️ Common Pitfalls to Avoid
Even experienced modelers make mistakes. Being aware of these pitfalls can save you significant rework.
- Mixing Concerns: Do not try to show runtime timing in a Profile Diagram. Profiles are about definition, not time. Do not try to show structural hierarchy in a Sequence Diagram; it is about flow.
- Over-Engineering Profiles: Creating a profile for every single small detail makes the model hard to maintain. Only profile elements that require specific semantic meaning.
- Ignoring Return Messages: In Sequence Diagrams, forgetting to show return messages can make the flow look incomplete. Always consider the response path.
- Lack of Actor Definition: A Sequence Diagram without external actors (users, other systems) is often incomplete. Define who initiates the interaction clearly.
- Static Constraints in Dynamic Flows: Do not clutter a Sequence Diagram with static constraints. Keep the behavior clean and refer to the Profile or Class Diagram for structural rules.
🔄 Maintenance and Evolution
Software is never static. As requirements change, your models must evolve. This is where the distinction between Profile and Sequence becomes crucial for maintenance.
Updating Profiles
When you update a Profile Diagram (e.g., adding a new stereotype), you must audit all existing Sequence Diagrams that use that stereotype. Ensure the new constraints do not break existing interactions. Because Profiles define the language, changes here are high-impact. Communicate Profile changes across the entire team.
Updating Sequences
Sequence Diagrams are often more fluid. They change with every feature sprint. However, do not discard them. When a Sequence Diagram changes, check if the underlying types (from the Profile) have changed. If a <<Service>> changes its interface, the Sequence Diagram must be updated to reflect the new message signatures.
Version Control
Both diagrams should be versioned. Treat the Profile as a schema and the Sequence as an instance of that schema. If you refactor the Profile, create a new version of the modeling standard. If you refactor the logic, update the Sequence version. This separation allows you to track architectural drift versus behavioral changes.
🧠 Final Thoughts on Modeling Choice
Selecting the right diagram for the right job is a skill that improves with practice. The Profile Diagram is your foundation. It sets the rules of the game. It ensures that when you speak of a "Service", everyone understands the same constraints and capabilities.
The Sequence Diagram is your story. It narrates how those services interact, how data moves, and how errors are handled. It brings the static structure to life.
By maintaining a clear distinction between the two, you avoid the common trap of creating diagrams that are neither clear nor useful. Use the Profile to establish your vocabulary. Use the Sequence to map your logic. Together, they form a complete picture of the system, bridging the gap between design intent and runtime reality.
Remember that models are tools for thinking, not just for documentation. If a diagram does not help you or your team understand the system better, it needs to be refined or discarded. Focus on clarity, consistency, and relevance. Whether you are extending the metamodel or mapping a message flow, the goal remains the same: reducing complexity and increasing understanding.

