


At first glance, a profile diagram appears straightforward. A collection of boxes connected by lines. It seems to be a map of structure, a blueprint of relationships. However, beneath that visual simplicity lies a dense network of semantic rules, constraints, and logical dependencies. Every single line drawn on a diagram carries weight. It is not merely a visual connector; it is a statement of intent, a declaration of ownership, and a constraint on data integrity. 🛑
When architects and engineers rely solely on the visual aspect of these diagrams, they risk overlooking the hidden complexity that dictates system behavior. A solid line implies something different than a dashed line. An arrow pointing one way suggests a dependency, while an arrow pointing the other might imply a dependency in the opposite direction. The absence of a label does not mean the absence of meaning; often, it implies a default behavior that must be understood to prevent future errors.
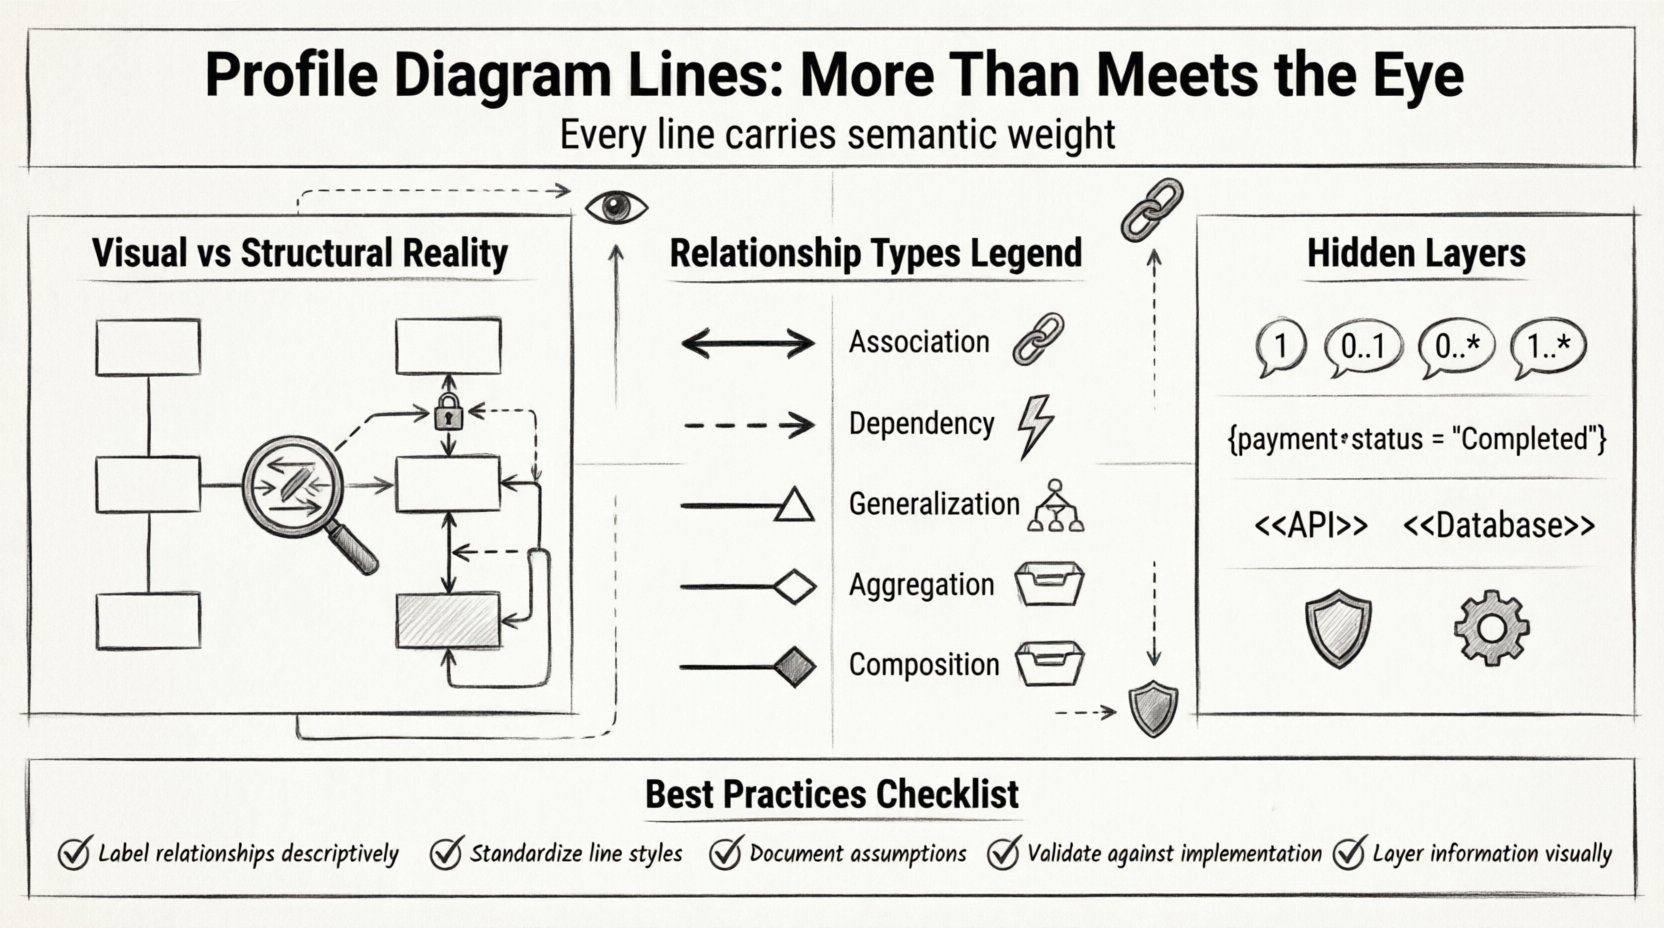
Visual Clarity vs. Structural Reality 👁️
The primary function of a profile diagram is communication. It translates abstract concepts into a visual language that stakeholders can interpret. However, this translation process introduces a layer of abstraction that can obscure the underlying mechanics. What looks like a simple connection in the diagram often represents a complex interaction in the runtime environment. 🔄
Consider the concept of visibility. In the diagram, a line connects two entities. In reality, that line defines who can access what. Is the connection public? Is it private? Does it require authentication? The diagram line does not always explicitly state these security protocols, yet the line implies the existence of a pathway. If the pathway is not secured, the entire structure is vulnerable.
To truly understand a profile diagram, one must look past the geometry. One must ask:
- What data flows through this line?
- How is that data transformed during transit?
- What happens if the connection fails?
- Who is responsible for maintaining this link?
These questions reveal the hidden complexity. A line is a promise. If the promise is not kept, the system breaks. Therefore, analyzing the lines requires a forensic approach, treating every connection as a critical component of the overall architecture.
The Semantics of Connection 🔗
Different types of lines convey different types of relationships. Understanding these distinctions is fundamental to accurate modeling. When a line connects two profiles, it defines the nature of their interaction. This interaction is not arbitrary; it follows specific rules derived from the modeling standard being used.
Here are the primary relationship types found in profile diagrams:
- Association: This represents a structural link between objects. It implies that instances of one class are linked to instances of another. It is often bidirectional, meaning both ends can navigate to the other.
- Dependency: This indicates that a change in the specification of one element may affect the other. It is a usage relationship, often temporary or transient in nature.
- Generalization: This represents inheritance. One element is a specialized version of another. The line usually ends with a hollow triangle pointing to the parent.
- Realization: This is used when one element implements the behavior defined by another, such as an interface implementation.
Each of these relationships carries different implications for data consistency and lifecycle management. An association might persist data, while a dependency might exist only during a specific operation. Confusing these two can lead to significant architectural flaws.
Comparison of Relationship Types
| Relationship Type | Line Style | Navigation | Lifecycle Impact |
|---|---|---|---|
| Association | Solid Line | Bi-directional (often) | High (Data Persistence) |
| Dependency | Dashed Line | Uni-directional | Low (Transient) |
| Generalization | Solid with Triangle | Inheritance | Medium (Polymorphism) |
| Aggregation | Solid with Diamond | Uni-directional | Medium (Shared Ownership) |
| Composition | Solid with Filled Diamond | Uni-directional | High (Exclusive Ownership) |
This table provides a quick reference, but the true complexity lies in the configuration of these lines. For instance, an aggregation line might imply that the child object can exist independently, whereas a composition line suggests the child cannot exist without the parent. This distinction is critical for database schema design and memory management.
Multiplicity and Cardinality 📊
One of the most significant sources of hidden complexity is multiplicity. This refers to the number of instances of one class that can be associated with a single instance of another class. On a diagram, this is often represented by numbers or symbols near the ends of the lines.
Common notations include:
- 1: Exactly one instance.
- 0..1: Zero or one instance (optional).
- 0..* or *: Zero or more instances (many).
- 1..*: One or more instances (required).
Ignoring multiplicity is a common pitfall. If a line is drawn without a multiplicity label, it defaults to a standard assumption. However, relying on defaults is dangerous. The explicit definition of multiplicity clarifies the rules of engagement between entities.
Consider a scenario where a User is associated with an Order. If the multiplicity is 1..*, a User must have at least one Order. If the multiplicity is 0..1, a User can exist without an Order. This difference dictates the validation rules applied at the application level. If the diagram does not reflect the actual business rules, the software built from it will be flawed.
Constraints and Guards 🛡️
Lines often carry additional metadata in the form of constraints. These are text strings placed in braces near the relationship line. They define the specific conditions under which the relationship is valid.
Examples of constraints include:
- Constraint: A rule that must be satisfied for the model to be valid.
- Guard Condition: A condition that must be true for a transition or relationship to occur.
- Derived: Indicates that the value is calculated from other data, not stored directly.
These constraints add a layer of logic that is not immediately visible. A simple line might be guarded by a condition that requires a specific role or status. Without reading the constraint text, the line appears simple, but the logic behind it is complex.
For example, a line connecting a “Payment” entity to a “Transaction” entity might have a constraint stating that the payment must be in a “Completed” state. This prevents invalid data from propagating through the system. Analyzing these constraints requires a deep understanding of the business domain, not just the diagram syntax.
Profile Extensions and Stereotypes 🧩
Standard diagrams often lack the specificity required for complex systems. To address this, profile extensions allow architects to define new types of elements and relationships. These are known as stereotypes.
Stereotypes are typically denoted by text in guillemets, such as <
Key points regarding stereotypes:
- Custom Semantics: They allow the diagram to speak the specific language of the project.
- Code Generation: In many workflows, stereotypes dictate how code is generated. A line marked with a specific stereotype might generate a specific API endpoint.
- Validation: They can trigger custom validation rules that are not part of the base modeling standard.
When analyzing a diagram with stereotypes, one must understand the profile definition. The line itself is generic, but the stereotype applied to it is specific. Ignoring the stereotype reduces the diagram to a generic shape, losing the valuable context provided by the extension.
Common Modeling Pitfalls ⚠️
Even with a solid understanding of the theory, errors occur frequently. These errors often stem from the assumption that the diagram is self-explanatory. Here are common pitfalls to avoid when analyzing profile diagram lines:
- Assuming Bidirectionality: Just because a line exists does not mean both ends can navigate to the other. Always check the arrowheads.
- Overloading Relationships: Using a single line type for multiple different purposes creates ambiguity. Use distinct relationship types for distinct meanings.
- Neglecting Navigation: The direction of the arrow indicates the navigation path. Reversing it changes the meaning entirely.
- Ignoring Derived Data: Lines representing derived data should be distinguished from lines representing stored data to avoid database redundancy.
- Mixing Logical and Physical: Do not mix conceptual relationships with physical storage details in the same diagram. Keep the concerns separate.
Each of these pitfalls introduces a layer of risk. When a developer interprets a diagram incorrectly, the resulting code will not match the design. This leads to technical debt and increased maintenance costs. A careful analysis of the lines prevents these issues before they manifest in the code.
Strategies for Robust Diagramming 🏗️
To ensure that the hidden complexity is managed effectively, specific strategies should be employed during the creation and review of profile diagrams. These strategies focus on clarity, consistency, and completeness.
1. Enforce Naming Conventions
Every line should have a label if it carries specific meaning. Avoid generic labels like “Link” or “Connect”. Use descriptive terms that reflect the business relationship, such as “Assigns” or “Contains”. Consistent naming reduces cognitive load for the reader.
2. Standardize Line Styles
Adopt a strict style guide for line thickness, color, and arrowheads. Consistency allows the eye to scan the diagram quickly. If all dependencies are dashed and all associations are solid, the visual pattern reinforces the semantic meaning.
3. Document Assumptions
Where the diagram cannot explicitly state a rule, document it in the accompanying notes or profile definition. Do not rely on implicit knowledge. Explicit documentation ensures that anyone reading the diagram understands the constraints.
4. Validate Against Reality
Regularly compare the diagram against the actual system implementation. If the code does not match the diagram, the diagram is outdated. A diagram that does not reflect the current state is worse than no diagram at all, as it misleads the team.
5. Layer the Information
Do not try to show everything in a single view. Use layers to separate concerns. One diagram might show the high-level associations, while another shows the detailed constraints. This reduces clutter and allows the reader to focus on the complexity relevant to their task.
Final Considerations 🏁
The analysis of profile diagram lines is a skill that requires patience and attention to detail. It is not enough to see the boxes and the lines; one must understand the gravity of every connection. The hidden complexity is what transforms a drawing into a functional specification.
By focusing on semantics, multiplicity, constraints, and stereotypes, architects can ensure that their diagrams are accurate representations of the system they design. This accuracy translates into better software, fewer bugs, and smoother collaboration among team members. The lines on the page are the foundation of the code that runs the world. Treat them with the respect they deserve.
Remember that a diagram is a living document. It evolves as the system evolves. Regular reviews are necessary to keep the complexity in check. As new requirements emerge, the lines must be redrawn to reflect the new reality. This continuous improvement process is the key to maintaining a healthy architecture.
Ultimately, the goal is clarity. When a stakeholder looks at the diagram, they should understand the system without needing a translation. The lines should speak for themselves, supported by the rigorous analysis of their underlying logic. This is the standard for professional modeling.

