


In the landscape of software architecture and systems engineering, clarity is paramount. Unified Modeling Language (UML) provides the foundational grammar, but real-world projects often require custom extensions to capture specific domain nuances. This is where the Profile Diagram becomes indispensable. It acts as the blueprint for the blueprint, defining how standard modeling elements should be interpreted within a specific context.
Understanding the anatomy of a Profile Diagram is crucial for architects who need to extend the UML metamodel without breaking compatibility. This guide dissects the core components, visual symbols, and relational arrows that define these diagrams. We will explore how stereotypes, tagged values, and constraints interact to create a robust modeling framework.
What is a Profile Diagram? 🏗️
A Profile Diagram is a specialized package diagram that defines a profile. A profile is a mechanism for customizing UML. It allows modelers to define new stereotypes, tag definitions, and constraint definitions without altering the underlying UML specification. Think of it as adding a new dialect to a language while keeping the core grammar intact.
These diagrams are typically used to:
- Define domain-specific modeling languages (DSMLs).
- Standardize naming conventions for specific project teams.
- Extend the metamodel to support specific platform requirements.
- Document the application of stereotypes across a system.
Unlike other diagram types that focus on runtime behavior or static structure, the Profile Diagram focuses on definition. It is the source of truth for how elements should be interpreted.
Core Components and Symbols 🔍
The visual language of a Profile Diagram is distinct. It relies on a combination of standard UML package notation and specific extensions. Below is a breakdown of the primary symbols you will encounter.
1. The Profile Package 📦
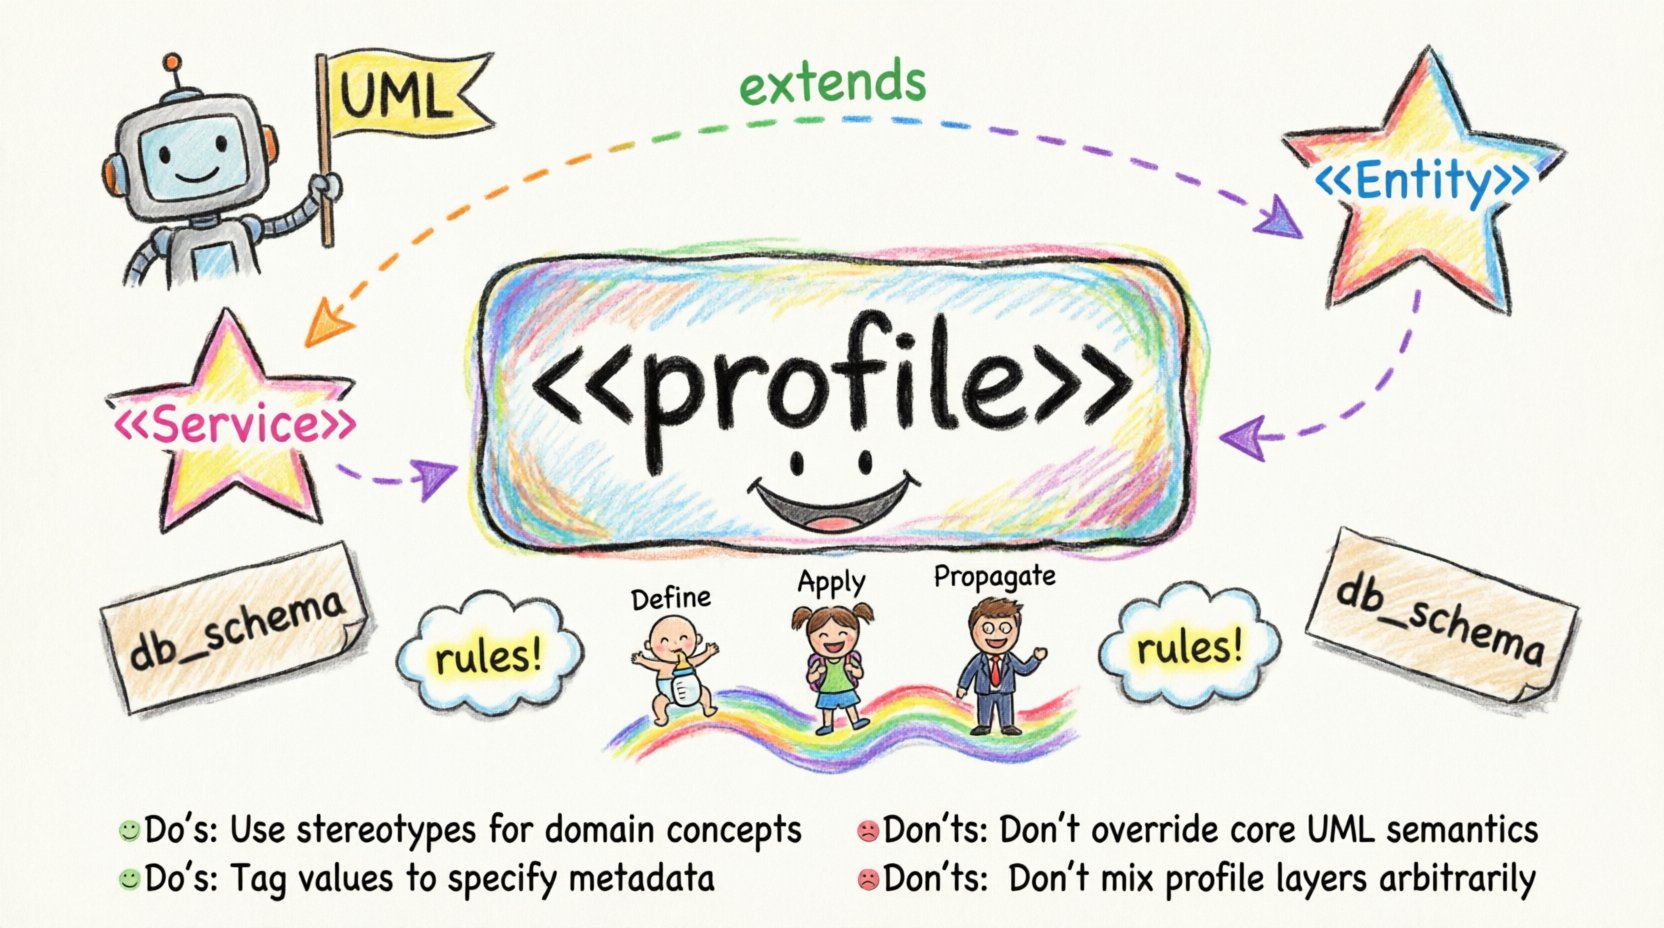
The root element of a Profile Diagram is the Profile itself, which is a specialized package. It is visually represented as a package with the stereotype <<profile>> above its name. This indicates that the contents within are intended to define extensions, not model the system itself.
2. Stereotypes ⭐
Stereotypes are the most visible component. They allow you to extend the types of UML elements. A stereotype is visually represented as a string enclosed in double angle brackets, like <<Service>> or <<Entity>>. In the Profile Diagram, the stereotype is defined as a class element. This class extends the base UML element it is intended to enhance.
3. Tagged Values 🏷️
Tags add metadata to elements. For example, a <<Database>> stereotype might need a tag to specify the SQL dialect. In the Profile Diagram, these are defined as properties of the stereotype class. They are often represented as attributes within the stereotype box.
4. Constraints 📝
Constraints define rules that elements must adhere to. These can be expressed using OCL (Object Constraint Language) or plain text descriptions. In the diagram, they appear as note symbols attached to the stereotype or the base element they constrain.
Visualizing Relationships: Arrows and Dependencies 🔗
The connections between elements in a Profile Diagram are critical for defining how the profile integrates with the base UML metamodel. Unlike implementation diagrams, these relationships are about semantic inheritance and usage.
Dependency Relationships
The most common arrow in a Profile Diagram is the dependency. It indicates that one element (the client) relies on another (the supplier). In the context of profiles, the stereotype class depends on the UML metaclass it extends.
- Direction: An arrow points from the stereotype to the base element (e.g., from <<Service>> to Class).
- Label: Often labeled with <<extension>> to clarify the nature of the relationship.
Association and Realization
While less common, associations can exist between different stereotypes. Realization arrows indicate that one stereotype implements the interface defined by another, allowing for complex hierarchies of behavior definitions.
Table: Relationship Types in Profile Diagrams
| Relationship Type | Visual Symbol | Meaning | Usage Example |
|---|---|---|---|
| Dependency | Dashed Arrow | One element requires another to function correctly. | Stereotype depends on UML Class. |
| Generalization | Solid Line with Hollow Triangle | Inheritance hierarchy. | Specific Profile extends Generic Profile. |
| Association | Solid Line | Structural connection. | Linking multiple stereotypes. |
| Note/Constraint | Dashed Line to Note Box | Additional rules or documentation. | Defining OCL rules for a tag. |
Understanding Lifelines and Contextual Flow 🔄
The term “Lifeline” is often associated with Sequence Diagrams, representing the existence of an object over time. In the context of a Profile Diagram, the concept is metaphorical but vital. It refers to the semantic lifecycle of the profile definition itself.
When we discuss lifelines in Profile Diagrams, we are examining:
- Definition Phase: The creation of the stereotype and its properties.
- Application Phase: The moment the stereotype is applied to a model element.
- Propagation Phase: How the stereotype rules flow to the instantiated elements.
Unlike a Sequence Diagram where a lifeline represents an active participant, a Profile Diagram “lifeline” represents the validity and scope of the definition. If a profile is deprecated, the “lifeline” of those stereotypes ends. If a profile is imported into another project, the definition is replicated, creating a new instance of that semantic lifecycle.
Managing Profile Scope
Profiles are not global by default. They must be explicitly imported or used within a specific package. This scoping mechanism ensures that the “lifeline” of a stereotype does not leak into unrelated systems. Proper management of this scope prevents naming conflicts and ensures that the diagram remains clean and maintainable.
Defining Tagged Values and Constraints 📊
Power in a Profile Diagram comes from the ability to store data within the model. This is achieved through tagged values and constraints.
Tagged Values
These are key-value pairs attached to model elements. For example, a class marked as <<Table>> might have a tagged value db_schema = "public". In the Profile Diagram, these are defined as attributes of the stereotype class.
- Type Definition: You must define the data type (String, Integer, Boolean).
- Default Value: You can specify a default value if none is provided during application.
- Mandatory vs. Optional: Constraints can force a tagged value to be present.
Constraints
Constraints are the rules of engagement. They prevent invalid model states. A constraint might state that a <<Service>> must have at least one <<Interface>> dependency.
Constraints are often represented using notes in the diagram. The text inside the note describes the rule. For complex logic, the note might reference an OCL expression stored externally. This separation keeps the visual diagram readable while maintaining rigorous logic.
Common Pitfalls in Profile Design 🚫
Creating a Profile Diagram requires discipline. Without it, the diagram becomes a source of confusion rather than clarity. Here are common issues to avoid.
- Over-Extension: Do not create stereotypes for every minor variation. Only extend when it adds significant semantic value.
- Missing Dependencies: If a stereotype relies on another stereotype, the dependency arrow must be explicit. Hidden dependencies lead to broken models.
- Confusing Base and Extension: Ensure the arrow points from the stereotype to the base element. Reversing this breaks the metamodel logic.
- Ignoring Import Rules: Profiles must be imported correctly. A profile defined in one package does not automatically exist in another.
Best Practices for Maintainability 🛠️
To ensure your Profile Diagrams remain useful over time, adhere to these structural principles.
1. Modularize Your Profiles
Do not create a single massive profile containing every possible stereotype. Instead, break them down by domain (e.g., a Database Profile, a Web Interface Profile, a Security Profile). This makes importing and managing them significantly easier.
2. Document Relied Upon Metaclasses
When defining a stereotype, clearly document which base UML element it extends. This is usually handled by the tooling, but in a diagram, it helps to label the extension relationship clearly. This reduces ambiguity for future modelers.
3. Use Standard Naming Conventions
Consistency is key. Use prefixes for stereotypes if they belong to a specific domain (e.g., <<DB_Table>> vs <<Web_Page>>). This helps in visual scanning and reduces cognitive load.
4. Validate Before Deploying
Before applying a new profile to a large project, validate it on a small scale. Check if the constraints hold true and if the tagged values behave as expected. This prevents widespread model corruption.
Integrating Profiles with Other Diagrams 🧩
A Profile Diagram does not exist in isolation. It is the foundation for other diagram types. Once a profile is defined, it can be applied to Class Diagrams, Component Diagrams, and even Deployment Diagrams.
Application Workflow
- Define: Create the Profile Diagram with all stereotypes and constraints.
- Save: Package the profile as a resource file.
- Import: Load the profile into the target project.
- Apply: Select the stereotype from the palette and apply it to elements.
- Verify: Check that tagged values and constraints are active.
This workflow ensures that the “lifecycle” of the definition is properly transferred to the instance diagrams. It bridges the gap between high-level architecture and detailed implementation.
Advanced: Profile Inheritance and Extension 🔁
Profiles can inherit from other profiles. This is a powerful feature for large enterprises managing multiple product lines. A parent profile might define a base set of security stereotypes, while child profiles extend these with specific protocols.
Visualizing this in a Profile Diagram involves using Generalization arrows between the Profile packages themselves. This creates a hierarchy of profiles, allowing for a “drill-down” approach to modeling. A developer can choose to use the specific child profile or inherit the generic parent behavior.
Example Scenario
Imagine a company building both mobile and web applications. They define a base <<UI_Element>> stereotype in a core profile. The Mobile Profile extends this to add touch-specific tags (e.g., gesture_type). The Web Profile extends the same base to add accessibility tags (e.g., aria_label). This inheritance structure is clearly visible in the Profile Diagram, ensuring that commonalities are not duplicated.
Conclusion on Structure and Clarity ✅
The Profile Diagram is a tool of precision. It does not show the system as it runs, but as it is defined. By mastering the symbols, arrows, and relationships within this diagram, you gain the ability to customize the modeling language to fit your specific needs. This customization is what separates a generic model from a domain-specific asset.
Remember that accuracy in the Profile Diagram ensures accuracy everywhere else. A mistake in a stereotype definition propagates to every diagram that uses it. Therefore, investing time in the breakdown and validation of these components is an investment in the integrity of the entire system design.
As you build your models, keep the Profile Diagram visible. It is the contract between your team and the language you use to describe the software. Treat it with the same care as the code itself.

