


In the landscape of business process management, a map is only as valuable as the compass that guides it. Many organizations invest heavily in modeling their workflows using standard notations, creating detailed diagrams that outline the flow of work from initiation to completion. However, a visual representation without quantitative backing often remains a static artifact rather than a dynamic tool for improvement. To truly understand the health of an operation, it is necessary to connect every distinct step within a process to specific Key Performance Indicators (KPIs). This alignment transforms abstract activities into measurable data points, allowing leaders to identify bottlenecks, assess efficiency, and drive continuous improvement.
This guide explores the methodology for linking process steps to KPIs within a Business Process Model and Notation (BPMN) context. By establishing a clear relationship between actions and metrics, organizations can move from intuition-based decision-making to evidence-based management.
🏗️ The Core Relationship Between BPMN and Metrics
Business Process Model and Notation (BPMN) provides a standardized visual language for describing business processes. It uses symbols such as tasks, gateways, events, and flows to depict the lifecycle of work. While the notation excels at showing what happens and how it flows, it does not inherently capture how well it happens. This is where the integration of Key Performance Indicators becomes critical.
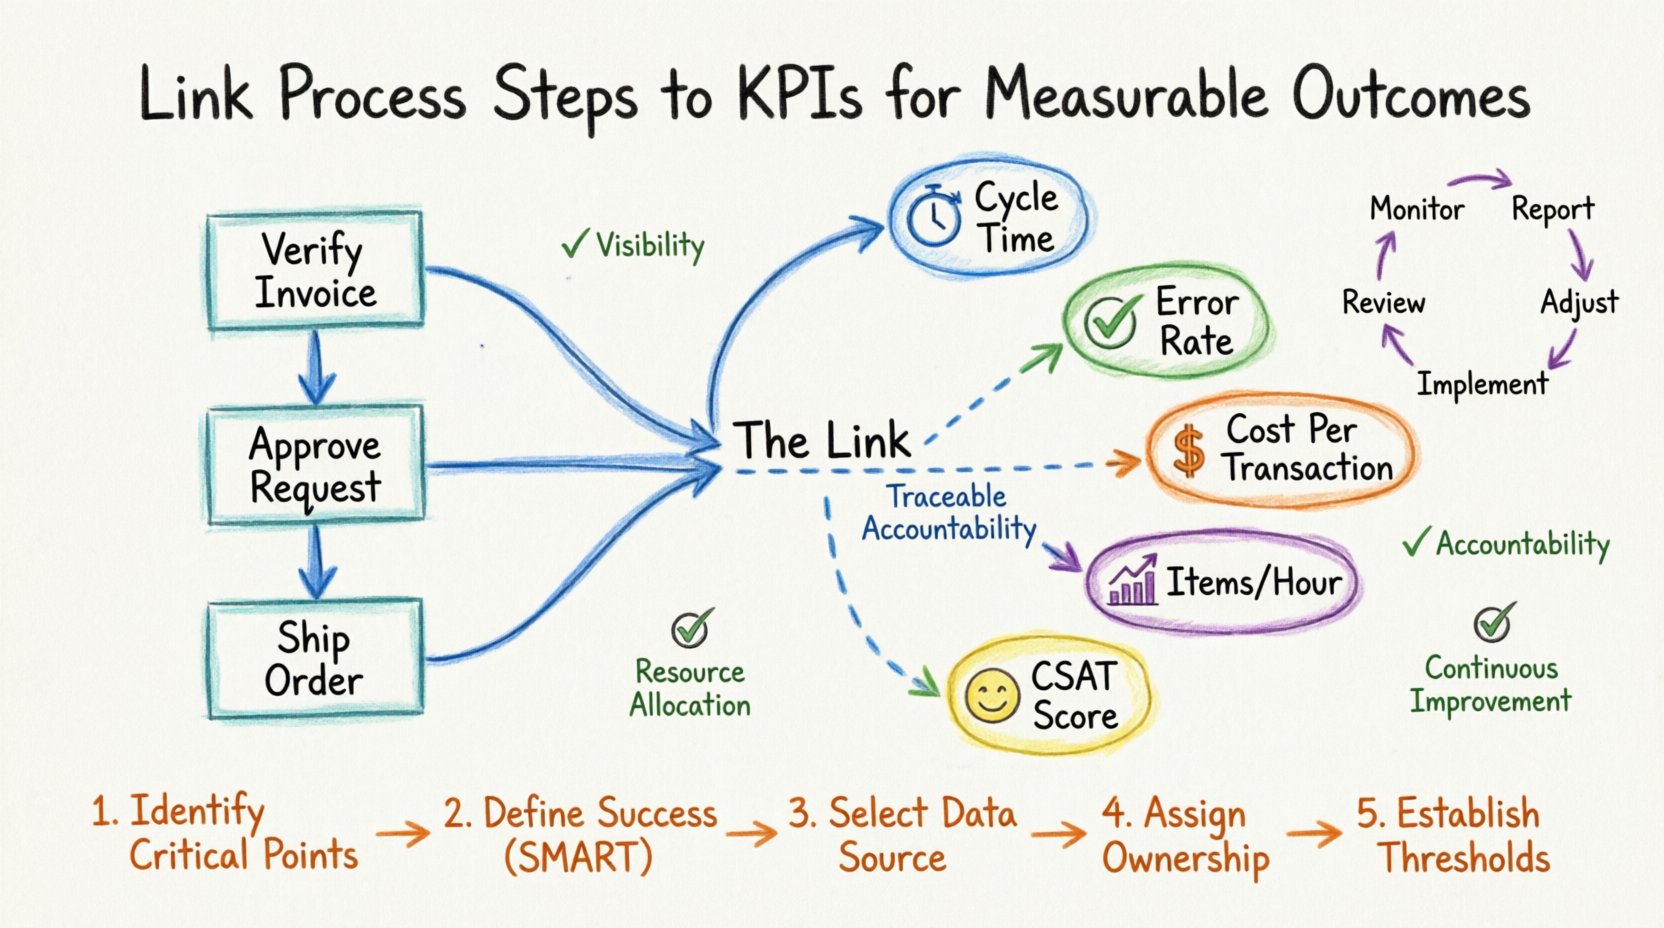
- Process Steps: These are the individual activities or tasks assigned to resources (human or automated). Examples include “Verify Invoice,” “Approve Request,” or “Ship Order.”
- Key Performance Indicators: These are quantifiable measures used to evaluate success. Examples include duration, error rate, cost per unit, or customer satisfaction score.
- The Link: The connection binds a specific BPMN element to a specific metric, creating a traceable line of accountability.
When these two elements are decoupled, process optimization becomes guesswork. If a process step takes too long, but there is no KPI attached to measure time, the delay remains invisible until it impacts the final deliverable. Linking steps to KPIs ensures that every part of the workflow is subject to scrutiny and evaluation.
🎯 Why Measurement Matters in Process Modeling
Measurement is not merely about collecting data for the sake of reporting. It serves several strategic functions within the operational framework.
- Visibility: It reveals the actual state of the process versus the designed state. Discrepancies between the model and reality become apparent.
- Accountability: When a metric is tied to a specific step, ownership becomes clearer. Stakeholders can see which areas require attention.
- Continuous Improvement: Data provides the baseline needed to test changes. Without measurement, it is impossible to know if a modification improved or degraded performance.
- Resource Allocation: Metrics highlight where resources are consumed most heavily, aiding in budgeting and staffing decisions.
Consider a scenario where a customer complaint handling process is modeled. Without KPIs, the model simply shows a path from “Receive Complaint” to “Resolve Issue.” With KPIs, the model reveals that the “Investigate Root Cause” step consumes 70% of the total resolution time, indicating a need for better training or tooling in that specific area.
📋 Categorizing Your KPIs for Process Steps
Not all metrics are created equal. To create a robust measurement framework, it is essential to categorize KPIs based on what they measure. Different process steps require different types of indicators. The table below outlines the primary categories relevant to BPMN step analysis.
| KPI Category | Focus Area | Example Metric | Relevant Process Step |
|---|---|---|---|
| Time-Based | Speed and Efficiency | Cycle Time | Approval Tasks, Transitions |
| Quality-Based | Accuracy and Compliance | Error Rate | Data Entry, Verification |
| Cost-Based | Financial Impact | Cost Per Transaction | Resource Intensive Activities |
| Volume-Based | Throughput | Items Processed Per Hour | Batch Operations |
| Experience-Based | User Satisfaction | CSAT Score | Customer Facing Tasks |
Using a mix of these categories ensures a balanced view of performance. Focusing solely on time might lead to rushed work and quality issues, while focusing only on quality might slow down throughput. The goal is to find the equilibrium that aligns with organizational strategy.
🧭 Methodology for Mapping Steps to Metrics
Creating the link between a process step and a KPI requires a systematic approach. It is not sufficient to assign a metric randomly. The following methodology ensures logical and actionable connections.
1. Identify Critical Control Points
Review the BPMN diagram to identify steps that have the highest impact on the overall outcome. These are often:
- Gateways where decisions are made.
- Tasks that involve external handoffs.
- Activities that consume the most resources.
- Steps where errors frequently occur.
2. Define the Success Criteria
For each critical control point, define what success looks like. Does “success” mean finishing quickly, or does it mean finishing with zero errors? The criteria must be specific, measurable, achievable, relevant, and time-bound (SMART).
3. Select the Data Source
Determine where the data for the KPI will originate. In a digital environment, this might be system logs, timestamps, or user inputs. In a manual environment, it might require surveys or manual logging sheets. The data source must be reliable and consistent.
4. Assign Ownership
Every KPI linked to a process step needs an owner. This is the person or role responsible for monitoring that metric and taking action when thresholds are breached.
5. Establish Thresholds
Define acceptable ranges for each metric. A cycle time of 24 hours might be acceptable, but 48 hours could trigger an alert. These thresholds guide the monitoring process.
📡 Data Sources and Collection Methods
The accuracy of the link between process steps and KPIs depends entirely on the quality of the underlying data. Collecting this data can be approached in several ways depending on the maturity of the organization’s digital infrastructure.
- System Logs: Most digital systems record timestamps for when a task is started and completed. This is the most accurate source for time-based KPIs.
- Manual Entry: For processes involving physical interaction, staff may need to log time or status manually. This introduces the risk of human error but is sometimes necessary.
- Automated Triggers: Events such as email notifications or database updates can signal the completion of a step without manual intervention.
- Surveys: For quality or experience metrics, direct feedback from the person receiving the output is required.
Regardless of the method, data integrity is paramount. Inconsistent logging practices can render the KPIs useless. Standardization of data entry formats and collection protocols is essential.
🔄 Analyzing the Results for Continuous Improvement
Once the data is collected and linked to the process steps, the analysis phase begins. The objective is to identify patterns and variances that indicate opportunities for optimization.
Identifying Bottlenecks
Bottlenecks appear as steps where the cycle time significantly exceeds the threshold or where work queues accumulate. By analyzing the KPI data, you can pinpoint exactly which step is slowing down the entire process.
Spotting Quality Drift
Quality metrics help detect when a process begins to degrade. If the error rate in a specific verification step rises over time, it may indicate fatigue, lack of training, or a change in the input data quality.
Evaluating Resource Utilization
Cost-based KPIs reveal whether resources are being used efficiently. If a step requires high labor input but produces low value output, it may be a candidate for automation or elimination.
Feedback Loops
The analysis should feed back into the process model. If data shows that a specific path is rarely taken, the model might be simplified. If a step consistently fails, the process design itself might need revision.
🛑 Common Challenges and Solutions
Implementing a KPI framework for process steps is not without difficulties. Recognizing these challenges early helps in developing effective mitigation strategies.
- Challenge: Data Silos
Data often resides in different systems that do not communicate.
Solution: Implement integration layers or middleware to aggregate data before it is analyzed. - Challenge: Metric Overload
Too many KPIs can confuse stakeholders and dilute focus.
Solution: Limit the number of active KPIs to the most critical few that drive strategic value. - Challenge: Inaccurate Baselines
Setting targets without historical context leads to unrealistic goals.
Solution: Collect baseline data for a set period before setting final targets. - Challenge: Resistance to Monitoring
Employees may feel monitored unfairly.
Solution: Frame metrics as tools for process improvement rather than individual surveillance.
🔁 Establishing a Feedback Loop
Measurement is not a one-time activity. It is an ongoing cycle that requires regular review. The feedback loop ensures that the process model evolves alongside the business environment.
- Monitor: Continuously track the KPIs linked to process steps.
- Report: Share findings with relevant stakeholders on a regular schedule.
- Review: Hold meetings to discuss variances and root causes.
- Adjust: Modify the process model or the metrics themselves based on insights.
- Implement: Roll out changes and return to monitoring.
This cycle prevents process stagnation. As business needs change, the metrics must change with them. A KPI that was relevant five years ago may no longer reflect the current strategic goals.
📊 The Impact of Granularity
The level of detail in the process model affects the granularity of the KPIs. A high-level process map might only show “Order Fulfillment.” A detailed BPMN diagram breaks this down into “Pick Item,” “Pack Box,” and “Label Package.”
Linking KPIs to granular steps allows for more precise intervention. If “Order Fulfillment” is slow, you cannot fix it without knowing which sub-step is responsible. By linking metrics to the granular level, you enable targeted improvements. However, this requires more data and more complex reporting structures.
🛠️ Practical Application Examples
To illustrate how this works in practice, consider the following scenarios within a typical business environment.
Scenario 1: Employee Onboarding
Process Step: IT Provisioning.
Linked KPI: Average Time to Provision.
Outcome: If the time exceeds the target, the IT team investigates if the request form is complex or if access rights are delayed.
Scenario 2: Procurement
Process Step: Vendor Approval.
Linked KPI: Percentage of Non-Compliant Vendors.
Outcome: If the percentage rises, the approval criteria are reviewed to ensure stricter compliance checks are in place.
Scenario 3: Customer Support
Process Step: Ticket Resolution.
Linked KPI: First Contact Resolution Rate.
Outcome: A low rate indicates that agents lack the authority or information to solve issues immediately, prompting a review of training or knowledge bases.
📈 Long-Term Benefits of Alignment
Sustaining the practice of linking process steps to KPIs yields significant long-term benefits for the organization.
- Strategic Alignment: Operational activities remain connected to high-level goals through their metrics.
- Culture of Data: Decisions become driven by evidence rather than opinion.
- Agility: The organization can respond faster to changes because problems are identified earlier.
- Transparency: Stakeholders have a clear view of how value is created and where friction exists.
This alignment creates a self-correcting system. As the organization grows, the process model and its associated metrics scale together, ensuring that efficiency is maintained even as complexity increases.
🧩 Final Thoughts on Implementation
Integrating Key Performance Indicators into Business Process Model and Notation diagrams is a fundamental step in mature process management. It bridges the gap between design and execution. By treating process steps as data-generating events rather than just visual nodes, organizations gain the insight needed to optimize their operations effectively.
The journey requires discipline in data collection and consistency in metric definition. It demands a willingness to scrutinize every activity for its value contribution. However, the reward is a business environment where performance is visible, manageable, and continuously improving. The map is no longer just a picture; it is a dashboard for operational excellence.

