


Enterprise Architecture (EA) often faces a persistent challenge: demonstrating tangible value to the business. Without clear measurement, EA teams risk being perceived as bureaucratic overhead rather than strategic assets. Executives need concrete data to justify investments in technology governance, standardization, and long-term planning. Moving from abstract blueprints to measurable outcomes is essential for securing ongoing support.
This guide outlines a framework for defining, tracking, and reporting on Enterprise Architecture Key Performance Indicators (KPIs). By focusing on specific metrics, organizations can quantify alignment, efficiency, and risk reduction. The goal is to shift the narrative from cost containment to value creation.
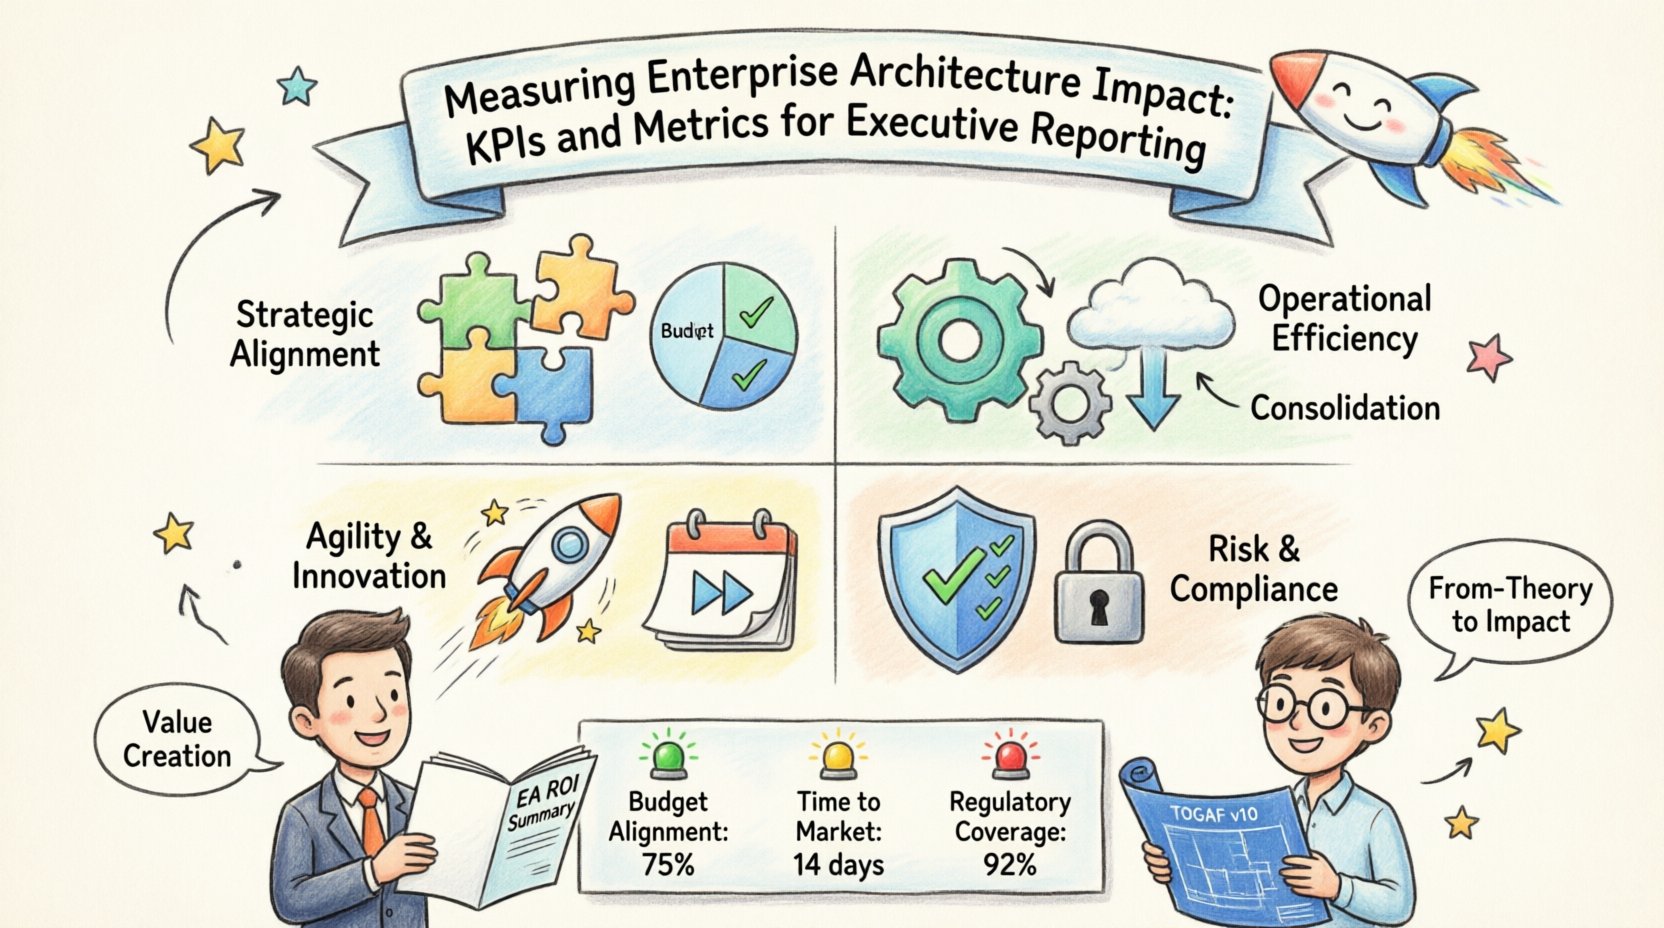
Why Measurement Matters in Enterprise Architecture 🎯
When stakeholders ask for a roadmap, they want to see where the organization is going and how quickly it can get there. EA provides the map, but metrics provide the speedometer. Without measurement, architectural decisions remain theoretical. With measurement, they become accountable actions.
Effective measurement serves three primary purposes:
- Strategic Alignment: It confirms that IT capabilities support business goals.
- Operational Efficiency: It highlights areas where technology spending can be optimized.
- Risk Management: It identifies vulnerabilities in the landscape before they become incidents.
Executives do not need a list of every diagram or document created. They need to understand how the architecture reduces friction, accelerates delivery, and protects the organization. The following sections detail the specific categories of metrics that address these concerns.
1. Strategic Alignment Metrics 🧩
The primary function of EA is to ensure technology serves business strategy. Alignment metrics measure the degree to which IT initiatives match organizational priorities. If the business strategy shifts, the architecture must adapt. These metrics quantify that adaptability.
Budget Alignment Ratio
This metric compares the budget allocated to strategic initiatives against the total IT budget. It answers the question: “Are we spending money on what matters?”
- Definition: The percentage of IT budget dedicated to projects mapped directly to strategic business objectives.
- Calculation: (Budget for Strategic Projects / Total IT Budget) * 100.
- Target: High percentages indicate strong alignment. Low percentages suggest funds are being consumed by maintenance or legacy systems.
Capability Coverage
Business capabilities define what the organization does. Technology capabilities support them. Coverage metrics identify gaps where business needs are not met by current technology.
- Definition: The percentage of critical business capabilities supported by mature technology solutions.
- Calculation: (Supported Capabilities / Total Critical Capabilities) * 100.
- Interpretation: A low score highlights specific areas where investment is required to enable business functions.
Initiative Success Rate
Not all projects deliver the expected value. EA influences this by ensuring projects are architecturally sound before funding is approved.
- Definition: The percentage of technology projects delivered on time, within budget, and meeting defined business outcomes.
- Why it matters: A high success rate indicates that architectural governance is preventing scope creep and technical debt accumulation.
2. Operational Efficiency Metrics 🛠️
Efficiency metrics focus on the cost and complexity of running the technology landscape. Reducing complexity directly correlates to lower operational costs and faster decision-making.
Technology Consolidation
Too many redundant systems create friction. Consolidation metrics track the reduction of duplicate applications and platforms.
- Definition: The count of redundant applications or the reduction in the total number of active systems over time.
- Calculation: Compare the system count at the start of the fiscal year to the end.
- Benefit: Fewer systems mean fewer licenses to manage, fewer security patches, and lower maintenance costs.
Technical Debt Ratio
Every system accumulates debt through shortcuts and legacy dependencies. EA tracks this to prevent it from stalling innovation.
- Definition: The ratio of effort required to maintain legacy systems versus building new capabilities.
- Calculation: (Maintenance Hours / Development Hours).
- Goal: Keep the ratio low. A high ratio indicates the organization is sinking into maintenance mode.
Infrastructure Utilization
Cloud and on-premise resources should be used effectively. Wasted resources are wasted budget.
- Definition: The percentage of allocated compute and storage resources actively in use.
- Insight: Low utilization suggests over-provisioning. High utilization suggests potential performance bottlenecks.
3. Agility and Innovation Metrics 🚀
Modern business requires speed. Architecture should not be a bottleneck. These metrics measure how well the EA framework enables rapid change and experimentation.
Time to Market for New Capabilities
This measures the duration from concept to production for a new feature or service.
- Definition: Average days from approval to deployment.
- EA Influence: Standardized patterns and reusable components reduce this time.
Deployment Frequency
Frequent releases indicate a flexible architecture that supports continuous integration and delivery.
- Definition: Number of successful deployments to production per time period (e.g., week or month).
- Significance: Higher frequency often correlates with lower risk per change and faster feedback loops.
Innovation Investment Share
Organizations must balance maintenance with growth. This metric tracks spending on experimental or new technologies.
- Definition: Percentage of total IT budget allocated to innovation projects (R&D, new pilots).
- Target: A healthy balance ensures the core remains stable while exploring new opportunities.
4. Risk and Compliance Metrics 🛡️
Security and compliance are non-negotiable. EA provides the visibility needed to manage risk across a distributed landscape. Reporting these metrics builds trust with the board and compliance officers.
Compliance Adherence Rate
Systems must meet regulatory and internal standards. This metric tracks violations.
- Definition: Percentage of systems or applications meeting all required security and compliance standards.
- Calculation: (Compliant Systems / Total Audited Systems) * 100.
Vulnerability Remediation Time
Finding a vulnerability is not enough; fixing it matters.
- Definition: Average time taken to patch critical vulnerabilities after detection.
- EA Role: Architecture standards ensure patching processes are standardized across the environment.
Vendor Concentration Risk
Reliance on a single provider creates supply chain risk.
- Definition: Percentage of critical functions dependent on a single vendor.
- Goal: Diversify the supply chain to prevent single points of failure.
Reporting to Executives: The Delivery Format 📈
Collecting data is only half the battle. How this data is presented determines whether it influences decision-making. Executives have limited time and need high-level insights, not raw data dumps.
Dashboard Hierarchy
Structure reports in layers. Start with the executive summary, then drill down into details.
- Level 1 (Strategic): Alignment, Risk, and Budget metrics. For the C-Suite.
- Level 2 (Tactical): Efficiency and Agility metrics. For VPs and Directors.
- Level 3 (Operational): Technical debt and utilization. For IT Managers.
Visualizing the Data
Use visual cues to indicate status quickly. Color coding is effective but must be consistent.
- Green: On target or meeting thresholds.
- Yellow: Attention required, trending towards risk.
- Red: Critical issue requiring immediate intervention.
Frequency and Cadence
Align reporting cycles with business planning. Monthly updates are too frequent for strategic metrics. Quarterly reviews allow for trend analysis.
- Quarterly Business Review (QBR): Focus on strategic alignment and budget utilization.
- Monthly Operational Review: Focus on risk, incidents, and efficiency.
Sample Executive Dashboard Structure 📋
Below is a structured example of how these metrics can be organized in a single view for an executive summary.
| Category | Key Metric | Current Value | Target | Status | Comment |
|---|---|---|---|---|---|
| Alignment | Budget Alignment Ratio | 75% | 80% | 🟡 | Legacy migration costs impacting new spend. |
| Efficiency | System Consolidation | -10 Systems | -15 Systems | 🟢 | On track to retire redundant ERPs. |
| Agility | Time to Market | 14 Days | 10 Days | 🔴 | Integration bottlenecks identified. |
| Risk | Compliance Adherence | 98% | 100% | 🟡 | One legacy vendor pending audit. |
Common Pitfalls to Avoid ⚠️
Even with a robust framework, mistakes in measurement can lead to misleading conclusions. Avoid these common errors to ensure data integrity.
Vanity Metrics
Do not report metrics that look good but do not drive action. For example, the number of diagrams created or the number of workshops held.
- Correction: Focus on outcomes, such as “Business Problems Solved” or “Cost Savings Realized”.
Lagging Indicators Only
Reporting only on what has already happened prevents proactive management. A project that failed last quarter is a lagging indicator.
- Correction: Include leading indicators, such as “Architectural Review Pass Rate,” which predicts future success.
Over-Complexity
A dashboard with 100 metrics is useless. Executives cannot absorb that much information.
- Correction: Limit the primary report to 5-7 critical KPIs. Allow drill-downs for deeper analysis if requested.
Ignoring Context
Raw numbers tell no story. A 10% increase in technical debt might be normal during a major migration.
- Correction: Always provide narrative context. Explain the “why” behind the numbers.
Implementing the Measurement Framework 📝
Starting a measurement program requires a phased approach. Do not attempt to measure everything at once.
Phase 1: Define the Baseline
Gather current data for the selected KPIs. Understand where the organization stands today. This establishes the starting point for improvement.
Phase 2: Establish Targets
Set realistic goals based on industry benchmarks and internal strategy. Targets should be ambitious but achievable.
Phase 3: Automate Collection
Reduce manual effort by integrating data sources where possible. Use existing monitoring tools to feed data into the EA repository.
Phase 4: Review and Iterate
Metrics should evolve as the business evolves. Regularly review the KPI list to ensure they remain relevant.
Final Thoughts on Value Demonstration 💡
Demonstrating the impact of Enterprise Architecture is a continuous process. It requires discipline in data collection and honesty in reporting. When leaders see clear connections between architectural decisions and business performance, the EA function becomes a trusted partner.
By focusing on alignment, efficiency, agility, and risk, you provide a comprehensive view of technology health. This data-driven approach transforms EA from a theoretical exercise into a practical business tool. The metrics selected should reflect the specific needs of the organization, but the principles of clear, actionable reporting remain constant.
Success is measured not by the complexity of the framework, but by the clarity of the insights provided to decision-makers. Start with the critical few, validate the data, and build the story around the numbers.

