


Enterprise Architecture often gets bogged down in abstract diagrams and static capability models. While these artifacts hold value, they frequently fail to answer the critical question: where does the technology actually create business value? Value Stream Mapping (VSM) offers a pragmatic approach to bridge this gap. It moves the conversation from “what systems do we have” to “how do we deliver value to the customer?”.
This guide explores how architects can leverage value stream mapping to connect strategic business outcomes with tangible technology investments. By visualizing flow, identifying waste, and aligning capabilities, you can ensure every dollar spent on infrastructure or application development serves a defined purpose.
🧭 Understanding Value Stream Mapping in an Enterprise Context
Value Stream Mapping originated in manufacturing to visualize the flow of materials and information. In Enterprise Architecture, the concept shifts slightly. We are no longer tracking physical parts, but rather information, decisions, and services that move through the organization.
For an architect, a value stream represents a sequence of activities that an organization performs to deliver value to a customer. These activities span multiple departments, systems, and stakeholders. The goal is not just to document the process, but to understand the efficiency and effectiveness of the delivery.
Key distinctions between traditional process mapping and VSM in architecture include:
- Focus on Value: It highlights which steps add value and which are non-value-added activities.
- End-to-End Perspective: It crosses functional silos, showing the journey from request to fulfillment.
- Technology Agnostic: It describes the “what” and “why” before defining the “how” or the specific tools.
- Metrics Driven: It incorporates cycle time, lead time, and work-in-progress limits to measure performance.
🔗 The Critical Link: Business Outcomes and Tech Investment
One of the persistent challenges in IT leadership is justifying investment. Technology budgets are often treated as a cost center rather than a value generator. Without a clear line of sight between spending and outcomes, optimization becomes difficult.
Value Stream Mapping provides the evidence needed to make these connections. When you map a value stream, you expose the dependencies. You see where technology acts as a bottleneck and where it acts as an enabler.
Why Alignment Matters
Alignment is not a one-time event. It requires continuous validation. Here is why linking business outcomes to technology investment through VSM is essential:
- Resource Prioritization: You can identify which capabilities require the most funding based on their contribution to the value stream.
- Risk Mitigation: Single points of failure in the value stream become visible, allowing for targeted investment in resilience.
- Stakeholder Trust: When business leaders see how their requests flow through the architecture, confidence in the IT function increases.
- Strategic Agility: A mapped value stream allows you to reconfigure technology components quickly when business needs shift.
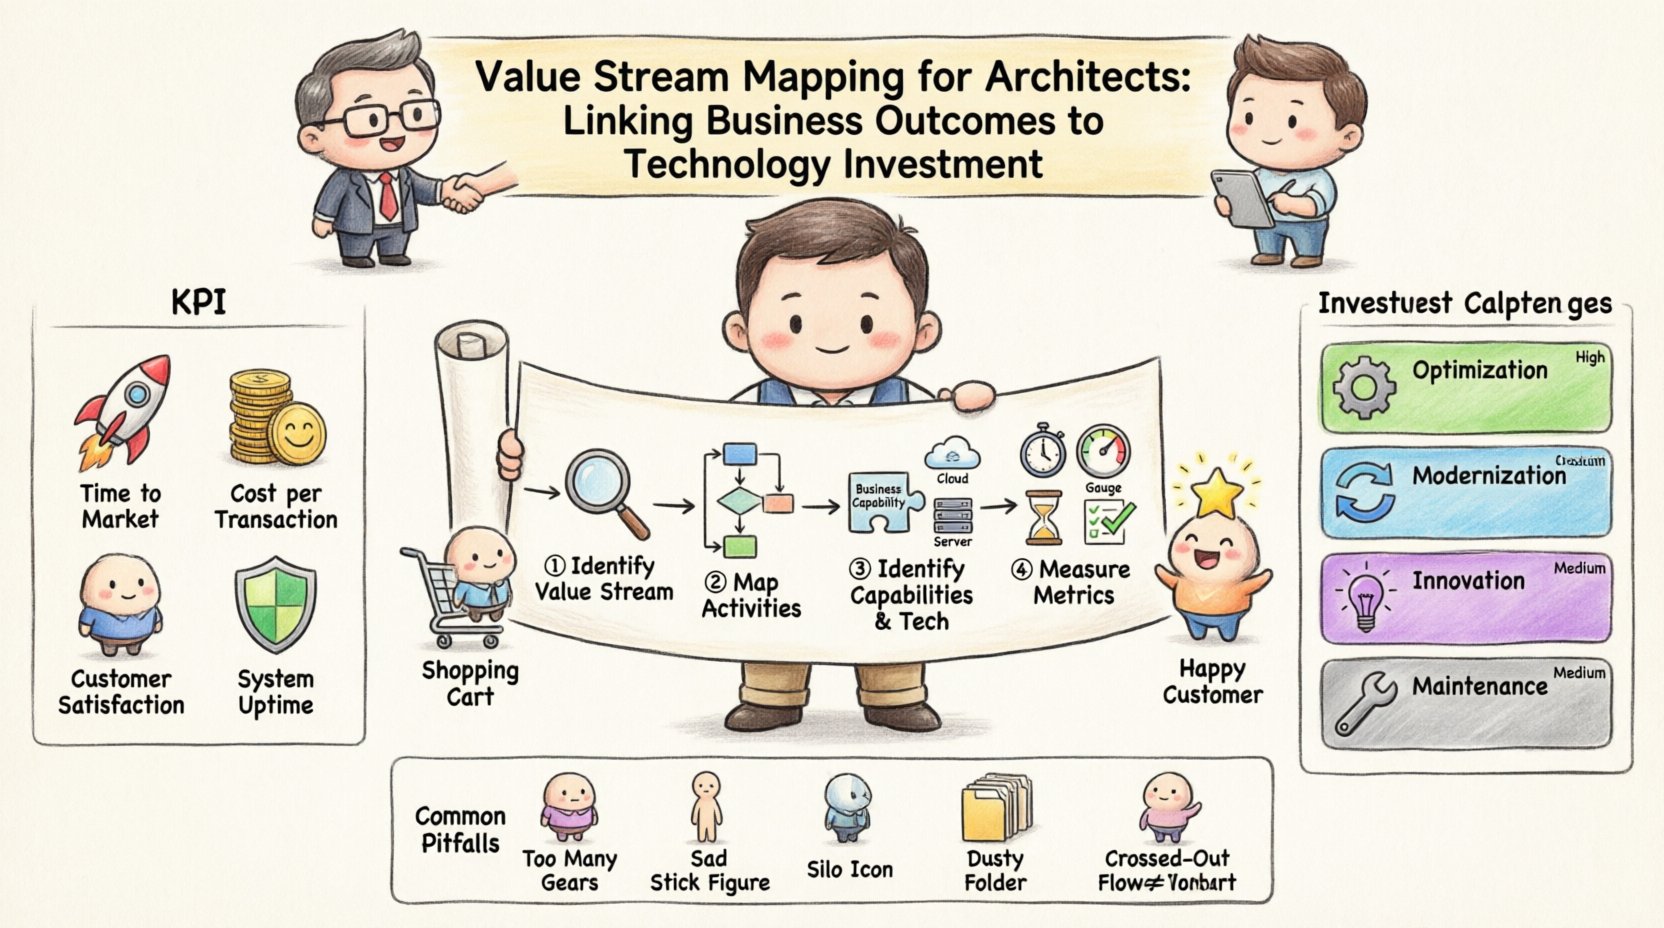
🛠️ Framework: Steps for Architects to Map Value Streams
Implementing this framework requires a structured approach. It is not about drawing a picture; it is about uncovering the reality of how work gets done. The following steps outline the process without relying on specific proprietary tools.
1. Identify the Value Stream
Start by selecting a primary value stream that is critical to the organization. Common examples include “Order to Cash,” “Hire to Retire,” or “Issue to Resolution.” The chosen stream should directly impact revenue, customer satisfaction, or regulatory compliance.
- Define the Trigger: What starts the stream? (e.g., a customer order).
- Define the Output: What ends the stream? (e.g., delivered product and invoicing).
- Scope the Boundaries: Clearly mark where the process begins and ends to avoid scope creep.
2. Map the Activities and Information Flow
List every step required to move from the trigger to the output. Group these steps logically. Distinguish between the steps that are necessary for value creation and those that are administrative overhead.
Simultaneously, map the information flow. What data is required at each step? Where does that data come from? Does it flow automatically, or is it manually entered?
3. Identify Capabilities and Technologies
This is the core architectural work. For each activity in the map, identify the business capabilities required to perform it. Then, identify the technology components that support those capabilities.
Create a clear linkage between:
- Business Capability: The ability of the organization to perform a function.
- Application/Service: The software or service enabling the capability.
- Infrastructure: The hardware or cloud environment hosting the service.
4. Measure Performance Metrics
Without data, the map is just a diagram. Collect metrics for each step. Focus on:
- Cycle Time: How long does it take to complete the step?
- Process Cycle Efficiency: The percentage of time spent on value-added work versus waiting.
- Quality: Error rates or rework frequency at each stage.
- Cost: The cost of running the technology at this stage.
📊 Analyzing the Investment Gap
Once the map is populated with data, you can analyze the relationship between investment and outcome. This analysis often reveals misalignment. For example, you might find a high-cost technology component supporting a low-value activity.
The table below illustrates a common scenario where technology investment does not match value contribution.
| Value Stream Step | Business Value | Technology Complexity | Investment Level | Status |
|---|---|---|---|---|
| Customer Onboarding | High (Revenue Driver) | Low | Medium | ⚠️ Under-Resourced |
| Legacy Reporting | Low (Compliance Only) | High (Technical Debt) | High | 🔴 Over-Invested |
| Order Fulfillment | High (Retention) | Medium | High | ✅ Optimized |
| Internal Approval | Low (Process) | Low | Low | ✅ Optimized |
In this scenario, the “Legacy Reporting” step consumes significant budget and technical effort but provides minimal business value. Conversely, “Customer Onboarding” is critical for revenue but is under-supported. VSM highlights these discrepancies clearly.
🚀 Prioritizing Technology Investment
With the analysis complete, the next phase is action. Architects must guide the investment committee on where to allocate funds. The decision matrix should prioritize value streams that drive the most business outcomes.
Investment Categories
- Optimization: Reducing waste in high-value streams. This often involves automation or streamlining processes.
- Modernization: Replacing legacy components that hinder speed in critical value streams.
- Innovation: Introducing new capabilities that open new value streams.
- Maintenance: Keeping the lights on. This should be minimized to free up budget for the above categories.
Decision Criteria
When evaluating a technology investment request, use the value stream map as a reference point. Ask the following questions:
- Does this investment support a high-value stream?
- Does it reduce cycle time in a critical bottleneck?
- Does it improve data quality for downstream activities?
- Can we retire a legacy system that currently drains resources?
If the answer to these questions is no, the investment should be reconsidered. This disciplined approach prevents the accumulation of technical debt that does not yield business returns.
📈 Measuring Success and Continuous Improvement
Mapping is not a one-time project. Value streams evolve as the market changes. To maintain alignment, architects must establish a feedback loop.
Key Performance Indicators (KPIs)
Track the following metrics to gauge the effectiveness of the architecture:
- Time to Market: How quickly can a new feature reach the value stream?
- Operational Cost per Transaction: Is the technology becoming more efficient over time?
- Customer Satisfaction Score: Does the improved flow translate to happier customers?
- System Uptime: Reliability of the technology supporting the stream.
Regular Reviews
Schedule periodic reviews of the value stream map. These reviews should involve business stakeholders, not just IT. This ensures the definition of “value” remains accurate. If the business strategy shifts, the value stream map must update to reflect new priorities.
⚠️ Common Pitfalls to Avoid
Even with a solid framework, pitfalls can derail the initiative. Architects should be aware of common traps when implementing VSM.
- Over-Engineering the Map: Do not try to map every single click or button. Focus on the high-level flow. Granularity comes later.
- Ignoring Human Factors: Technology enables the flow, but people execute it. Account for human decision points and cognitive load.
- Focusing Only on IT: Value streams often span non-IT departments. Excluding operations or sales leads to an incomplete picture.
- Static Documentation: A map that is created and filed away is useless. It must be a living artifact updated with business changes.
- Confusing Process with Value: Just because a process exists does not mean it adds value. Be ruthless in cutting non-value-added steps.
🤝 Collaboration Across the Enterprise
Successful value stream mapping requires cross-functional collaboration. Architects act as facilitators, bringing together business process owners, operations teams, and development leads.
Workshops are the most effective way to build these maps. They foster a shared understanding of the current state. During these sessions, ensure that:
- Roles are Clear: Who owns the map? Who owns the changes?
- Voices are Heard: Ensure frontline staff contribute, as they see the bottlenecks best.
- Outcomes are Defined: Agree on what success looks like before starting the mapping.
🏁 Summary of Architectural Impact
Integrating value stream mapping into Enterprise Architecture transforms the role from a gatekeeper to a strategic partner. It provides the evidence needed to justify technology spend. It shifts the focus from system functionality to customer outcomes.
By visualizing the flow of value, architects can make informed decisions about where to invest, where to cut, and where to innovate. This clarity drives efficiency and ensures that technology remains a driver of business growth rather than a burden.
The journey requires discipline and continuous engagement, but the result is a resilient, responsive architecture that directly supports the organization’s goals.

