Now Reading: Mastering UML Deployment Diagrams with Visual Paradigm: From Manual Design to AI Generation
-
01
Mastering UML Deployment Diagrams with Visual Paradigm: From Manual Design to AI Generation


Mastering UML Deployment Diagrams with Visual Paradigm: From Manual Design to AI Generation
In the complex world of software architecture, visualizing how software artifacts map to physical hardware is crucial for ensuring scalability, security, and high availability. A UML Deployment Diagram serves as this bridge, illustrating the runtime architecture of a system. It defines the hardware topology, the software distribution across execution environments, and the communication protocols binding them together.

Visual Paradigm has evolved this essential modeling practice by integratingAI-powered features. Whether you prefer the precision of manual drafting or the speed of natural language generation, this guide explores how to leverage Visual Paradigm to create professional deployment diagrams effectively.
Understanding the Core Concepts
Before diving into the tools, it is essential to understand what a deployment diagram models. Unlike otherUML diagrams that focus on code structure or logical behavior, the deployment diagram focuses on the static deployment view of a system. It is particularly useful for planning infrastructure for distributed systems, client/server architectures, cloud environments, and embedded devices.
Primary Elements and Notation
A deployment diagram is built using a specific set of symbols and notations designed to represent the physical world:
- Nodes: Represented as a 3D box, a Node signifies a computational resource. This can be hardware (e.g., a server, a mobile device) or an execution environment (e.g., a JVM, a container, or an operating system). Nodes can be stereotyped for clarity, such as
<<device>>or<<AWS EC2>>, and can be nested to show hierarchy (e.g., a server inside a data center). - Artifacts: Depicted as a rectangle with a folded top-right corner or the
<<artifact>>stereotype, artifacts represent the concrete physical units of the software. Examples include.jarfiles, executable.exefiles, database schemas, or.warfiles. Artifacts are manifested on nodes to show where they run. - Communication Paths: These are solid lines connecting nodes, often annotated with stereotypes like
<<HTTP>>or<<TCP/IP>>to indicate the communication protocol used between hardware elements. - Dependencies: Dashed arrows indicate that one node or artifact relies on another to function correctly.
Leveraging AI for Rapid Diagram Generation
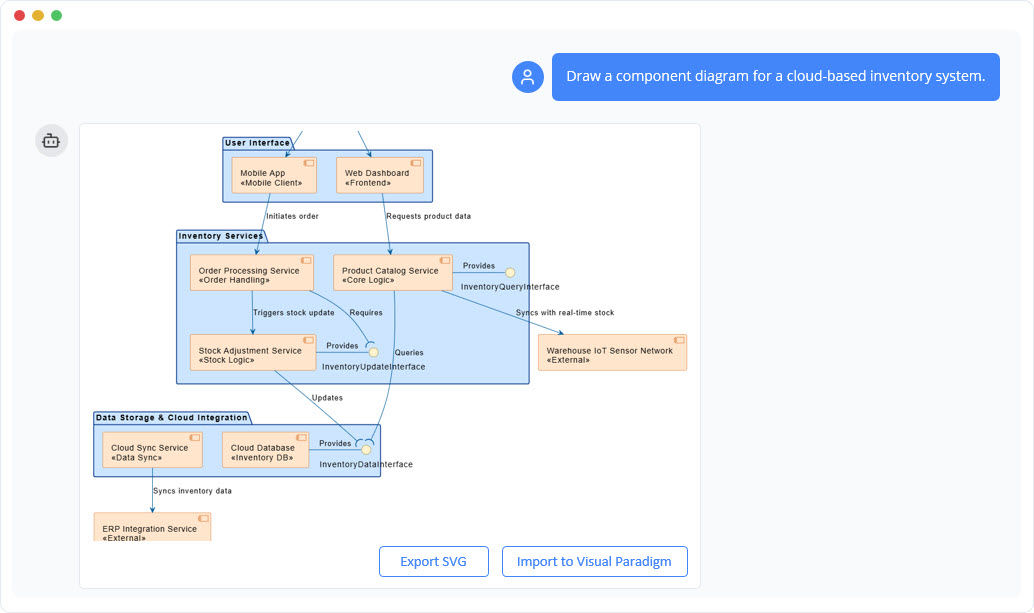
One of the most significant advancements in Visual Paradigm is the inclusion of an AI chatbot capable of generating diagrams from text. This feature is particularly powerful for rapid prototyping or translating architectural requirements into visual models without manual drawing.
To create a UML Deployment Diagram using AI, follow this workflow:
- Access the Tool: Navigate to the Visual Paradigm AI chatbot at
chat.visual-paradigm.com. - Input a Prompt: Describe your architecture in natural language. For example: “Create a UML deployment diagram with two nodes: a Client Machine and a Web Server.”
- Iterative Refinement: The AI allows for conversational updates. You can refine the model by adding specific details, such as: “Deploy an artifact named ‘web-app.war’ onto the Web Server node” or “Add an AWS Application Load Balancer in front of the EC2 instance.”
- Finalize and Export: Once the diagram accurately reflects your infrastructure, you can export it or import it into the full Visual Paradigm desktop or online editor for granular customization.
This AI-driven approach significantly reduces the time required to scaffold complex architectures, such as C4 deployment views or cloud topologies.
Manual Creation in Visual Paradigm
For users who require pixel-perfect control or need to integrate the diagram into a larger project file manually, Visual Paradigm offers a robust drag-and-drop interface:
- Select the Diagram: Go to Diagram > New > Deployment Diagram.
- Define Nodes: Drag Node shapes from the toolbar onto the canvas. Name them appropriately (e.g., “Database Server”, “iOS Client”).
- Add Artifacts: Drag Artifact shapes onto the specific nodes where they will reside.
- Establish Connections: Use the Resource Catalog or connector lines to draw associations between nodes, defining the communication paths and protocols.
Example: Cloud-Based E-Commerce System
To illustrate the power of these tools, consider a scenario where an architect needs to model an e-commerce inventory system hosted on AWS. Using the AI prompt “Draw a UML Deployment Diagram for an e-commerce inventory system on AWS including EC2, Lambda, DynamoDB, and S3,” the resulting diagram would typically include:
- Nodes: An encompassing
<<device>> AWS VPCcontaining an<<executionEnvironment>> AWS EC2 Instanceand an<<executionEnvironment>> AWS Lambdanode. - Storage: A
<<database>> AWS DynamoDBnode for product data and a<<storage>> AWS S3 Bucketfor static assets. - Infrastructure: An
<<device>> AWS Application Load Balancerhandling traffic and a Firewall protecting the VPC boundaries. - Communication Paths: HTTPS links from the Load Balancer to the EC2 instance, invocation paths from EC2 to Lambda, and read/write paths from Lambda to DynamoDB.
Best Practices for Deployment Modeling
Whether using AI or manual tools, adhering to best practices ensures your diagrams remain communicative and useful:
- Focus on Architecture: Highlight significant aspects like load balancers, firewalls, and redundancy mechanisms (High Availability) rather than every minor cable.
- Use Stereotypes: Standardize your visual language using stereotypes like
<<cloud>>,<<server>>, or<<mobile>>to make the diagram instantly readable. - Model Security: For distributed and cloud systems, explicitly model security groups, firewalls, and VPC boundaries to indicate network isolation.
- Plan for Operations: Consider deployment aspects such as versioning, rollback strategies, and monitoring when defining artifacts.
By combining the structural rigour of UML with the speed of Visual Paradigm’s AI, architects can create detailed, accurate, and scalable deployment diagrams that effectively communicate the physical reality of their software systems.
Visual Paradigm AI Powered Deployment Diagram Resource
The following articles and resources provide detailed information on using AI-powered tools to create and manage deployment diagrams within the Visual Paradigm platform:
-
How to Create a UML Deployment Diagram for Cloud Apps with AI: This article provides a step-by-step guide on using AI-powered tools to efficiently generate UML deployment diagrams specifically for cloud applications.
-
AI-Powered C4 Diagram Generator – Visual Paradigm AI: The AI-powered generator supports the documentation of the four core levels of the C4 Model, including the context, container, component, and deployment views.
-
PlantUML Deployment Diagram Builder – Visual Paradigm Integration: Users can generate and edit deployment diagrams using PlantUML syntax with full visualization and editing support integrated within the Visual Paradigm platform.
-
What is a Deployment Diagram? A Complete Guide to UML Deployment Diagrams: This comprehensive guide explains the purpose and components of UML deployment diagrams and outlines best practices for modeling software system architecture.
-
Deployment Diagram Features in Visual Paradigm Software: Visual Paradigm offers advanced features for creating deployment diagrams, including drag-and-drop modeling, real-time collaboration, and full UML integration.
-
Deployment Diagram in the Software Design Handbook: The software design handbook provides practical insights into using deployment diagrams to design scalable and maintainable software systems.
-
Step-by-Step Tutorial: Creating Deployment Diagrams with Visual Paradigm: A hands-on tutorial walks users through the process of building deployment diagrams from scratch, covering nodes, artifacts, and real-world relationships.
-
Beginner’s Guide to Deployment Diagrams Using Visual Paradigm Online: This beginner’s guide explains how to use Visual Paradigm Online to model system deployment and infrastructure using UML deployment diagrams.
-
Free Deployment Diagram Software: Visual Paradigm Online: Visual Paradigm Online offers a suite of free tools for creating professional deployment diagrams directly in a web browser without the need for software installation.
-
C4 Model Deployment Diagram for Internet Banking System: This specific deployment diagram template illustrates the physical architecture of an internet banking system based on the C4 modeling framework.
-
How to Draw a Deployment Diagram in UML: Step-by-Step Tutorial: This comprehensive guide covers the technical steps for creating UML deployment diagrams, including nodes and system relationships, within the Visual Paradigm environment.
-
Drawing Deployment Diagrams: Visual Paradigm User Guide: The official user guide provides the technical steps and best practices required to draw accurate and professional deployment diagrams.