Business processes rarely exist in isolation. They involve interactions between multiple parties, systems, and departments. When a single process involves complex exchanges, understanding the trajectory of information becomes critical. This is where Conversation Diagrams play a vital role. They provide a specialized view within the Business Process Model and Notation (BPMN) framework designed specifically to map communication flows between participants. By focusing on the messages exchanged rather than the internal logic of each party, these diagrams offer clarity on how different entities coordinate their activities.
Creating a robust communication map requires a clear understanding of the underlying notation and the intent behind the visual elements. This guide explores the mechanics of designing these diagrams, the structural components involved, and the best practices for ensuring accuracy and maintainability. Whether you are defining service interactions or mapping departmental handoffs, a well-constructed diagram reduces ambiguity and aligns expectations.
Understanding the Purpose of Conversation Diagrams 🎯
A Conversation Diagram is a specific type of Collaboration Diagram in BPMN 2.0. While standard Process Diagrams focus on the internal logic of a single participant, Conversation Diagrams zoom out to show the big picture. They answer the question: “How do these different parties talk to each other?”
This level of abstraction is essential for several reasons:
- Visibility of Interactions: It highlights the critical messages that trigger changes in state across the organization.
- Decoupling of Logic: It separates the “what” from the “how.” You define the message exchange without detailing the internal workflow of the receiver.
- Choreography Focus: It supports the concept of choreography, where no single participant controls the entire flow, but rather the flow is determined by the sequence of agreed-upon messages.
Without this specific diagram type, teams often rely on complex Sequence Diagrams or overloaded Collaboration Diagrams, which can become difficult to read when the scope expands. A dedicated Conversation Diagram keeps the focus strictly on the exchange protocol.
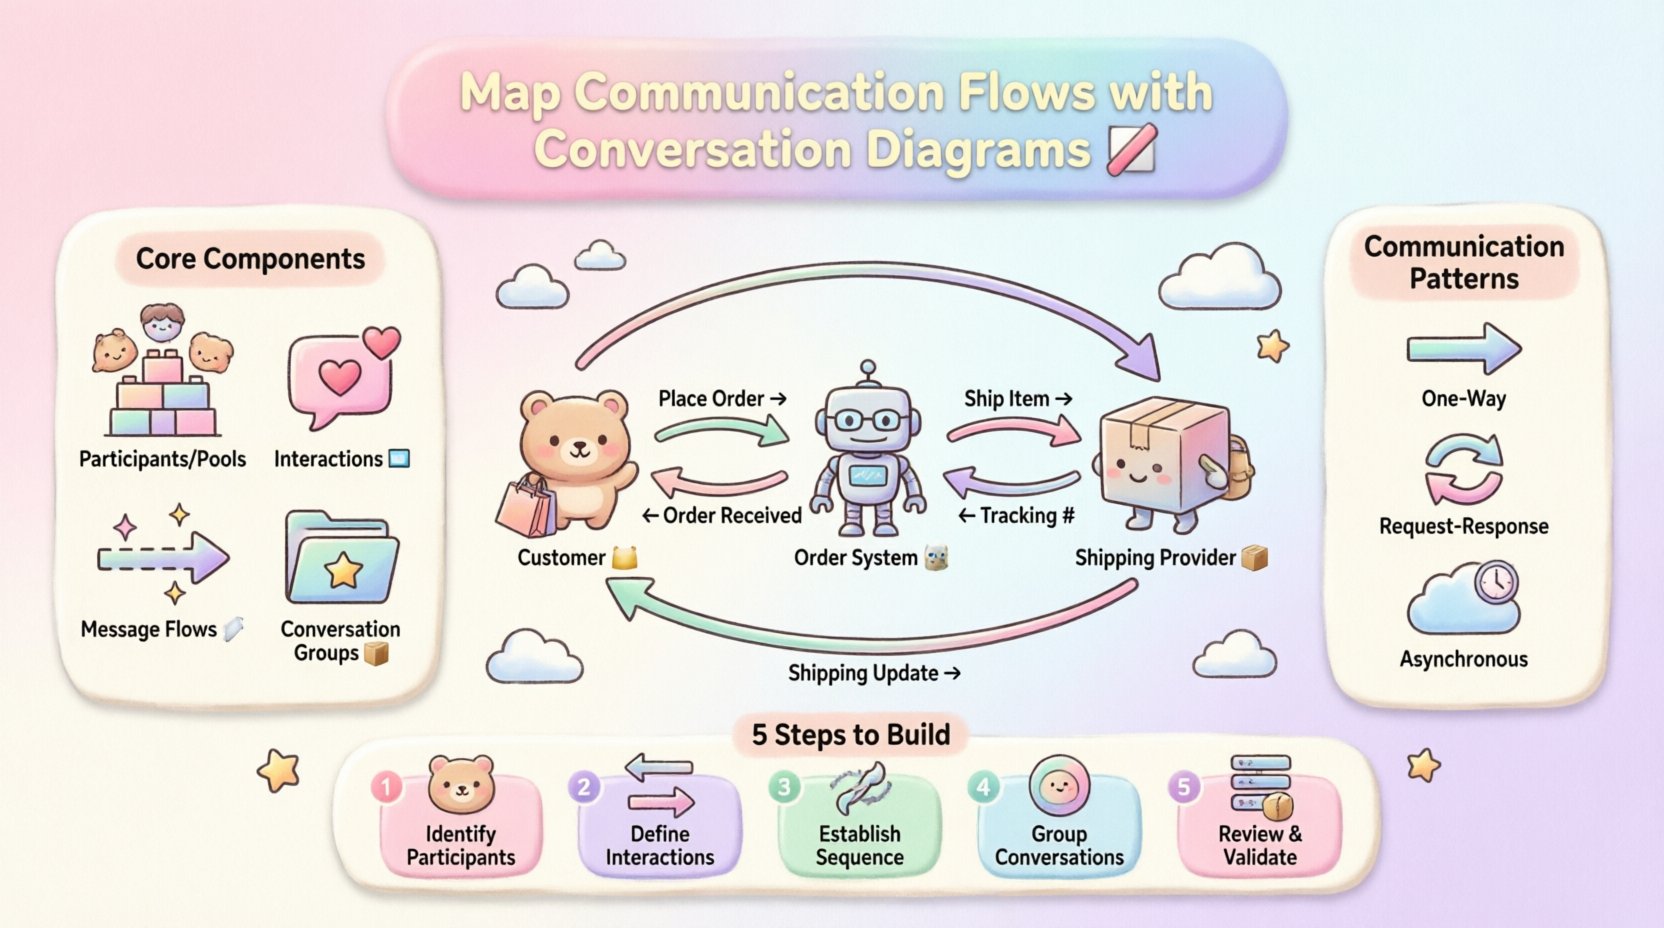
Core Components of the Diagram 🧩
To build an accurate model, you must understand the specific elements available in the notation. Each element serves a distinct function in defining the communication landscape.
1. Participants (Pools) 🏢
Participants represent the distinct entities involved in the conversation. In BPMN terms, these are typically modeled as Pools. Unlike standard process pools that contain detailed internal activities, a Participant in a Conversation Diagram is often a simplified boundary.
- External Systems: Banks, payment gateways, or third-party APIs.
- Internal Departments: Sales, Logistics, or Customer Support.
- Human Roles: Customers, Managers, or Administrators.
Each participant acts as a container for the interactions they are involved in. They define the boundary of responsibility for a specific part of the conversation.
2. Interaction (Conversation Node) 💬
The Interaction is the fundamental unit of communication. It represents a specific exchange of information, such as a request, a confirmation, or a notification. In the diagram, it is represented as a rounded rectangle placed inside a Participant.
Key attributes of an Interaction include:
- Name: A descriptive label for the message content (e.g., “Submit Order,” “Send Invoice”).
- Type: Defines the nature of the exchange (e.g., One-Way, Request-Response).
- Scope: Indicates which participants are involved in this specific interaction.
By grouping interactions, you can visualize the lifecycle of a business transaction from initiation to completion.
3. Message Flow (Communication Path) 📡
Message Flows connect Interactions between different Participants. They show the direction of the information transfer. Unlike Sequence Flows, which connect activities within a single participant, Message Flows cross the boundaries of Pools.
When drawing these flows, ensure they connect an Interaction in one Participant to an Interaction in another. Do not connect Activities directly to Activities across participants, as this violates the communication abstraction.
4. Conversation Node (Logical Grouping) 📂
For complex scenarios, you may need to group multiple interactions under a single logical heading. This is achieved using a Conversation Node. It allows you to define a high-level conversation that encompasses several smaller exchanges.
- Label: Names the overarching conversation (e.g., “Order Fulfillment Process”).
- Participation: Lists which Participants are part of this specific conversation.
This is particularly useful when a single process involves multiple steps that are logically related but span different timeframes.
Step-by-Step Construction Guide 🛠️
Building a Conversation Diagram requires a methodical approach. Rushing into the drawing phase often leads to structural errors. Follow this logical workflow to ensure a robust model.
Step 1: Identify the Participants
Start by listing all external and internal entities that must exchange information to achieve the business goal. Do not include every possible stakeholder; focus only on those directly involved in the message exchange. For example, in a loan application process, the participants might be the “Customer,” the “Bank,” and the “Credit Bureau.”
Step 2: Define the Interactions
For each Participant, list the interactions they initiate or receive. Ask questions such as:
- What information does this party send?
- What information does this party expect to receive?
- Is the response immediate or asynchronous?
Assign a unique name to each interaction to distinguish it from others. Clarity here prevents confusion during implementation.
Step 3: Establish the Sequence
Arrange the interactions in the order they occur. This creates the flow of the conversation. Use Message Flows to connect the sending interaction to the receiving interaction. Ensure the directionality is correct. A message cannot flow from a Receiver back to a Sender without a corresponding new interaction.
Step 4: Group into Conversations
Once the individual flows are mapped, group them into logical conversations. If the interactions belong to a single business case, enclose them in a Conversation Node. This helps stakeholders understand the scope of the model without getting lost in the details of every single message.
Step 5: Review and Validate
Walk through the diagram with the stakeholders involved. Verify that:
- Every message has a clear sender and receiver.
- There are no orphaned interactions.
- The flow covers all necessary error states or exceptions.
- The diagram matches the agreed-upon business contract.
Types of Communication Patterns 📊
Not all communication looks the same. Different business scenarios require different patterns of interaction. BPMN supports various types of message flows to represent these nuances accurately.
One-Way Communication
In this pattern, a message is sent from one participant to another without an expectation of a direct reply. This is common for notifications, logs, or data synchronization.
- Example: Sending a “Password Reset Request” email.
- Diagram Element: A single Message Flow with no return path.
Request-Response
This is the most common pattern in transactional systems. One party sends a request and waits for a specific response before proceeding.
- Example: Submitting an Order and receiving an “Order Confirmed” message.
- Diagram Element: A forward Message Flow followed by a return Message Flow.
Asynchronous Communication
Here, the sender does not wait for the receiver to process the message immediately. The sender continues its own process while the receiver handles the message at its own pace.
- Example: A background job processing a report generation request.
- Diagram Element: Message Flows often use intermediate events to represent the waiting period.
Distinguishing Choreography from Orchestration 🤖
When mapping communication flows, it is crucial to understand whether you are modeling choreography or orchestration. While both involve interaction, they differ in control.
| Feature | Choreography (Conversation Diagram) | Orchestration (Process Diagram) |
|---|---|---|
| Control | Decentralized. No single party controls the flow. | Centralized. One party (the orchestrator) directs the flow. |
| Focus | Message exchange between participants. | Internal steps of the orchestrator. |
| Visibility | Global view of all participants. | View of the orchestrator’s perspective. |
| Use Case | Inter-organizational processes. | Internal departmental workflows. |
Choosing the correct model ensures that the diagram accurately reflects the reality of the business process. If a central controller exists, a Process Diagram is usually sufficient. If the process is distributed, a Conversation Diagram is the appropriate tool.
Best Practices for Clarity and Maintenance 📝
A diagram that is too complex becomes useless. Adhering to design principles ensures longevity and usability.
- Keep It High-Level: Do not include internal activities inside the Participant pools. If you need to show internal logic, link to a separate Process Diagram.
- Consistent Naming: Use standardized terminology for all interactions. Avoid synonyms for the same message type.
- Limit Participants: If a diagram has more than 5-6 participants, consider breaking it into multiple Conversation Diagrams based on functional areas.
- Use Groups: Use logical groups to organize related interactions. This reduces visual clutter.
- Define Exceptions: Explicitly model what happens if a message is not received or is rejected. This is often overlooked but critical for system resilience.
Common Pitfalls to Avoid ⚠️
Even experienced modelers make mistakes when mapping communication flows. Being aware of common errors helps you avoid them.
1. Connecting Activities Across Pools
Never draw a line from an Activity in Pool A directly to an Activity in Pool B. This implies a direct control flow, which is impossible. Always route through Interactions.
2. Ignoring Message Types
Not all messages are equal. Some are synchronous, some are asynchronous, and some carry data while others are signals. If the distinction matters for the implementation, annotate the Message Flow with the specific type.
3. Overloading the Diagram
Trying to map every single message in a large system into one diagram leads to spaghetti. Split the model into logical segments. For instance, separate the “Order Placement” conversation from the “Payment Processing” conversation.
4. Missing the Return Path
Ensure that for every request, there is a defined response path. A request without a response creates a dead end in the logic.
Real-World Scenario: Order Fulfillment 🛒
Consider a standard retail order process. The participants are the Customer, the Order System, and the Shipping Provider. The conversation flows as follows:
- Customer → Order System: Sends “Place Order” interaction.
- Order System → Customer: Sends “Order Received” confirmation.
- Order System → Shipping Provider: Sends “Ship Item” request.
- Shipping Provider → Order System: Sends “Tracking Number”.
- Order System → Customer: Sends “Shipping Update”.
This sequence demonstrates a clear choreography. No single party dictates the entire timeline; the flow is driven by the exchange of these specific messages. Mapping this using a Conversation Diagram allows the IT team to set up the API contracts and the business team to understand the customer journey.
Integrating with Other Models 🔗
Conversation Diagrams do not exist in a vacuum. They are part of a larger ecosystem of models. Understanding how they integrate is key to a holistic view.
- With Process Diagrams: Use the Conversation Diagram to define the contract. Use the Process Diagram to implement the internal logic for each participant. The Interaction name in the Conversation Diagram should match the Task name in the Process Diagram.
- With Data Models: Ensure the data payload described in the Interaction matches the schema in your data dictionary. This alignment prevents integration errors.
- With Test Plans: The Message Flows in the diagram serve as the basis for integration testing. Each flow represents a test case scenario.
Maintaining the Diagram Over Time 🔄
Business processes evolve. Communication protocols change. A Conversation Diagram is a living document that requires maintenance.
When a process changes, ask:
- Has a new participant been added?
- Is the sequence of messages altered?
- Are the message payloads modified?
If the answer is yes, update the diagram immediately. Outdated communication maps lead to system failures and misaligned expectations. Establish a review cycle where stakeholders validate the diagram against the current operational reality.
Technical Considerations for Implementation 💻
When translating the diagram into technical specifications, keep these factors in mind.
- Message Formats: Define the format (JSON, XML, CSV) for each Interaction.
- Transport Protocols: Specify how the Message Flow is transported (HTTP, MQ, Email).
- Security: Indicate if the communication requires authentication or encryption. This is crucial for external participants.
- Idempotency: Determine if a message can be processed multiple times without side effects. This is important for asynchronous flows.
Conclusion on Communication Mapping 🏁
Mapping communication flows is a foundational skill for effective business process management. It bridges the gap between business requirements and technical implementation. By using Conversation Diagrams, teams can visualize the exchange of information without getting bogged down in the internal mechanics of each party.
Focus on the interactions, respect the boundaries of the participants, and maintain clarity in the message flows. A well-designed diagram serves as a contract between all parties involved, ensuring that everyone understands their role in the process. With careful construction and regular maintenance, these diagrams become valuable assets that support agility and reduce operational risk.
As you continue to model processes, remember that the goal is clarity. If the diagram requires a legend to explain the symbols, it is too complex. Simplify the model until the communication flow is self-evident. This discipline leads to better systems and smoother business operations.

