Organizations exist to solve problems and deliver value. However, the path from current performance to desired outcomes is rarely linear. Without a clear understanding of where you stand today, planning for the future is a guesswork exercise. This guide explores the critical discipline of mapping As-Is and To-Be states within the context of Business Process Model and Notation (BPMN). By visualizing the current reality and designing the future state, businesses can implement change with precision and confidence. 🎯
Why Process Mapping Matters 📊
Change management often fails because it targets symptoms rather than root causes. Employees report inefficiencies, but leadership lacks the data to validate where the friction lies. Visualizing processes provides a shared language between technical teams, operational staff, and strategic planners.
When you map your processes, you achieve several key objectives:
- Visibility: You see the entire workflow, not just isolated tasks.
- Standardization: You establish a baseline for what “good” looks like.
- Communication: Complex logic becomes easy to explain with diagrams.
- Identification: Bottlenecks and redundancies become obvious.
This clarity is the foundation for any successful transformation initiative. It moves the conversation from opinion to evidence. 🧐
Understanding the As-Is State 🏗️
The As-Is state represents the current reality of how work gets done. It is not about how work should happen; it is about how it actually happens. This often includes workarounds, manual interventions, and undocumented steps that have accumulated over time.
Characteristics of the As-Is Process
Mapping the current state requires honesty. You must document the process exactly as it functions, including inefficiencies. If a manager approves a form via email instead of the system, that is part of the As-Is state. Ignoring it creates a false baseline.
Key elements to capture include:
- Process Start and End: What triggers the work? When is it considered complete?
- Actors and Roles: Who performs each step? Is it one person or a team?
- Tools and Systems: What software, hardware, or physical tools are used?
- Inputs and Outputs: What data enters the process, and what is produced?
- Exceptions: What happens when things go wrong? (e.g., rejected applications, stockouts).
- Decision Points: Where does the path split based on conditions?
Collecting As-Is Data
Gathering accurate information requires a mix of observation and interview. Relying solely on documentation is risky, as documents are often outdated.
- Shadowing: Watch the process happen in real-time.
- Workshops: Bring the team together to draw the flow.
- Logs and Metrics: Review system data for cycle times and error rates.
- Surveys: Ask employees about pain points and delays.
During this phase, avoid judgment. The goal is documentation, not optimization yet. You are building the map before you plan the route. 🗺️
Designing the To-Be State 🚀
The To-Be state is the vision of the future. It represents the ideal way work should be performed to meet strategic goals, reduce costs, improve quality, or enhance customer experience. This design should not just be “faster”; it should be smarter.
Designing the future state involves removing waste and adding value. It is the architectural blueprint for your transformation.
Principles of To-Be Design
- Eliminate Non-Value Add: Remove steps that do not contribute to the customer’s needs.
- Automate Where Possible: Identify repetitive tasks suitable for system automation.
- Standardize: Ensure the process is consistent regardless of who performs it.
- Integrate: Connect systems to reduce manual data entry.
- Empower: Give staff the information they need to make decisions locally.
Aligning with Strategy
A To-Be process must support business objectives. If the goal is speed, the process must minimize handoffs. If the goal is compliance, the process must enforce checks and balances. The design should be a direct translation of strategy into operational reality.
Consider the following when designing the To-Be state:
- Customer Impact: How does this change the experience for the client?
- Employee Experience: Does this make the job easier or more frustrating?
- Risk Management: Are there new risks introduced by the change?
- Scalability: Can this process handle growth without breaking?
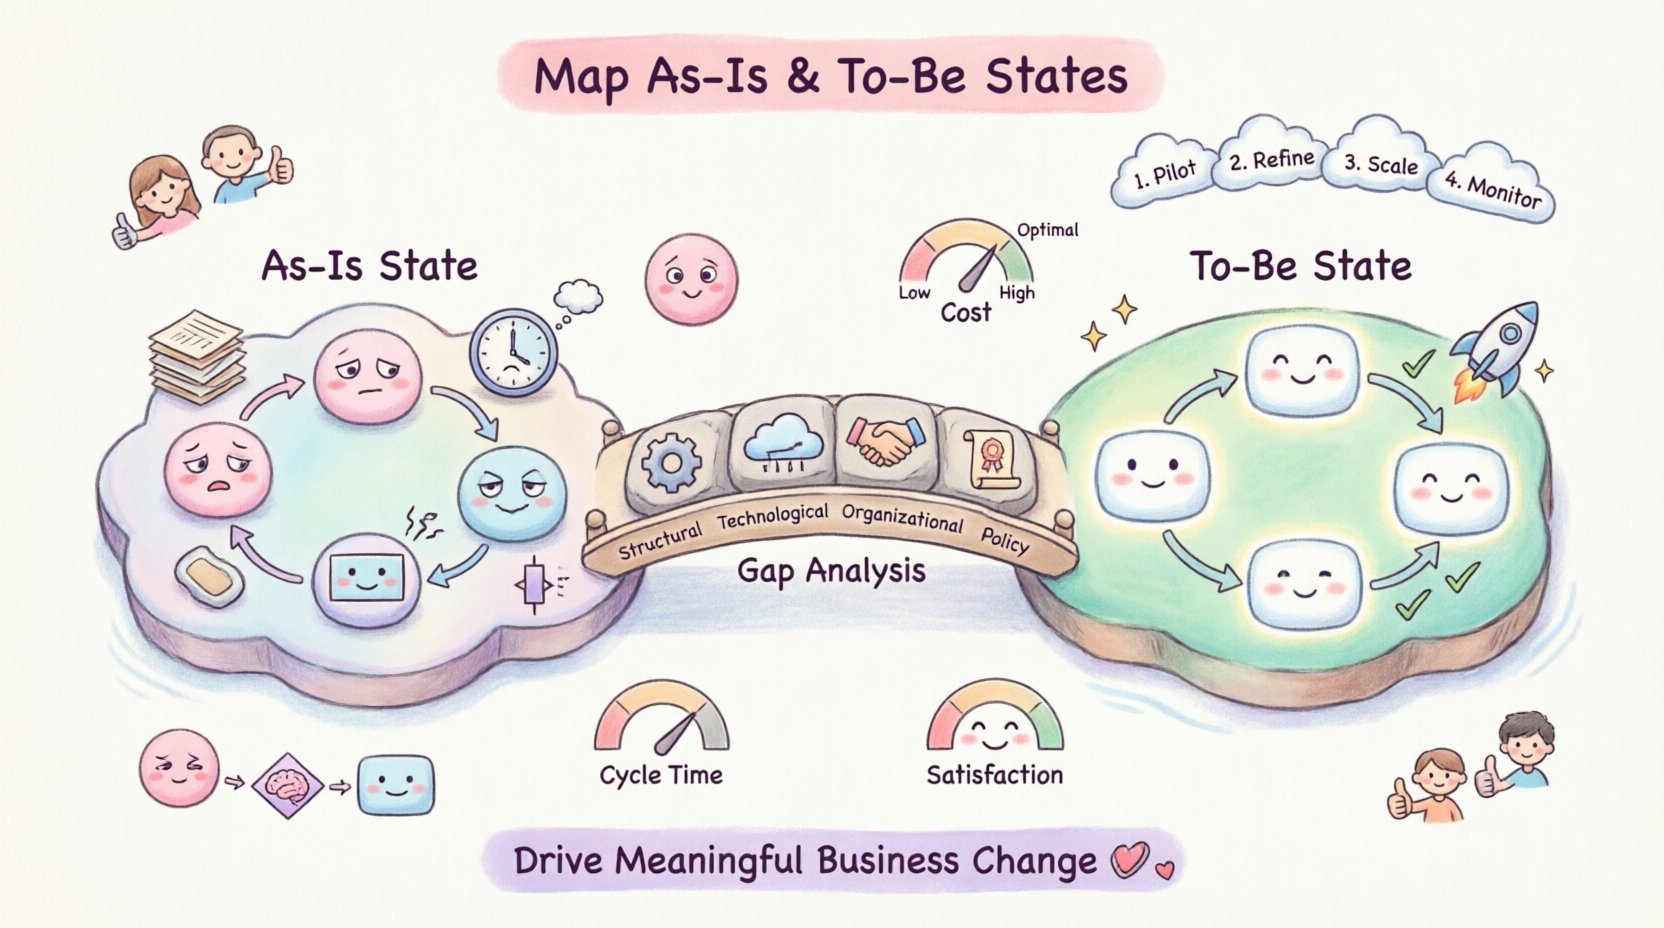
The Gap Analysis Bridge 🔗
The gap analysis is the critical link between the As-Is and To-Be states. It identifies the difference between where you are and where you need to be. This document drives the project plan.
Identifying the Gaps
Compare the two maps side by side. Look for differences in:
- Sequence: Are steps reordered?
- Logic: Are decision points changed?
- Resources: Are different roles or tools required?
- Duration: How much time is saved or added?
- Compliance: Are regulatory requirements met better in the new state?
Categorizing Changes
| Gap Type | Description | Action Required |
|---|---|---|
| Structural | Changes to the flow or sequence of steps. | Redesign the workflow logic. |
| Technological | Introduction or removal of systems. | Procure, configure, or retire tools. |
| Organizational | Changes to roles or responsibilities. | Update job descriptions and training. |
| Policy | Changes to rules or governance. | Update manuals and approval matrices. |
Understanding the type of gap helps in planning the implementation strategy. A structural change requires training. A technological change requires IT integration. Mixing these up leads to project delays. ⚙️
BPMN Best Practices for Modeling 🎨
Business Process Model and Notation (BPMN) provides a standardized way to draw these states. Using standard symbols ensures that anyone familiar with the notation can read your diagrams. This universality prevents miscommunication.
Core Elements to Utilize
- Events: Circles that mark the start, end, or intermediate occurrences.
- Activities: Rounded rectangles representing tasks or work.
- Gateways: Diamonds that control the flow (decisions, merges).
- Sequence Flows: Arrows showing the order of steps.
- Message Flows: Dashed lines showing communication between pools.
- Pools and Lanes: Containers that define the process boundaries and roles.
Rules for Clear Diagrams
A diagram that is too complex defeats the purpose. Follow these rules for clarity:
- Keep it Flat: Avoid crossing lines. Use lane changes if necessary.
- Label Everything: Every arrow and shape should have a clear label.
- One Start, One End: Keep the flow logical and linear where possible.
- Use Swimlanes Wisely: Assign each lane a specific role or department.
- Limit Depth: If a process has too many sub-processes, break it into a hierarchy.
Consistency is key. Use the same colors for the same types of events across all diagrams in your organization. This visual language speeds up understanding. 👁️
Managing Change Through Mapping 🤝
Technical accuracy is only half the battle. The human element determines success. When you introduce a To-Be state, people worry about their roles. Mapping helps mitigate this by showing the path forward clearly.
Engaging Stakeholders
Involve the people who do the work in the mapping process. They know the pain points better than anyone. When they contribute to the As-Is and To-Be models, they take ownership of the change.
- Invite Feedback: Ask teams to critique the draft models.
- Validate Assumptions: Ensure the design matches reality before building.
- Communicate Benefits: Explain how the new process helps them personally.
Addressing Resistance
Resistance often stems from fear of the unknown. Detailed process maps reduce ambiguity. When employees can see exactly what is expected, anxiety decreases. Use the maps to guide training programs.
Common concerns to address:
- Job Security: Show how roles evolve rather than disappear.
- Workload: Demonstrate how automation reduces burden.
- Complexity: Simplify the new process compared to the old one.
Transparency builds trust. The maps serve as the contract between leadership and the workforce. 🤝
Implementation and Rollout 📅
Once the To-Be state is defined and approved, the focus shifts to execution. This phase requires a structured approach to ensure the design translates into action.
Phased Approach
- Phase 1: Pilot: Test the new process in a small group or department.
- Phase 2: Refine: Gather feedback and adjust the model.
- Phase 3: Scale: Roll out to the wider organization.
- Phase 4: Monitor: Track performance against targets.
Training and Support
Use the diagrams as training materials. They are visual aids that are easier to digest than text manuals. Create quick reference guides based on the To-Be maps.
- Sandbox Environments: Allow users to practice the new process safely.
- Support Channels: Establish help desks for questions during rollout.
- Documentation: Keep the process manual updated alongside the diagrams.
Support is critical during the early days. Users will make mistakes. Treat errors as learning opportunities, not failures. 🛠️
Measuring Success and Optimization 📈
The work does not end at implementation. Processes must be monitored to ensure they deliver the intended value. Continuous improvement relies on data.
Key Performance Indicators (KPIs)
Define metrics that align with the goals of the To-Be state. Common metrics include:
- Cycle Time: How long does it take to complete the process?
- Cost Per Transaction: What is the financial cost of execution?
- First Pass Yield: How often is the process done correctly the first time?
- Customer Satisfaction: How do clients rate the experience?
- Error Rates: How many exceptions or reworks occur?
Continuous Feedback Loop
Business environments change. The To-Be state today may become the As-Is state of tomorrow. Establish a routine for reviewing process maps.
- Quarterly Reviews: Check if the process still meets business needs.
- Change Requests: Allow stakeholders to request updates to the model.
- Version Control: Maintain a history of changes to the process diagrams.
This cycle ensures the organization remains agile. It prevents processes from becoming obsolete. 🔄
Common Pitfalls to Avoid ⚠️
Even with a solid plan, mistakes happen. Being aware of common traps helps you navigate the journey smoothly.
- Ignoring the As-Is: Skipping the current state analysis leads to unrealistic designs.
- Over-Complexity: Trying to map every edge case makes the model unusable.
- Top-Down Only: Designing without input from the people who do the work creates friction.
- Static Thinking: Treating the map as a one-time deliverable instead of a living document.
- Tool Obsession: Focusing on the drawing tool rather than the process logic.
Focus on the value the process delivers, not just the perfection of the diagram. 🎨
Final Considerations for Sustainable Change 💡
Sustainable business change requires discipline. It is not a one-off project but a capability. By mastering the art of mapping As-Is and To-Be states, organizations build a framework for continuous adaptation.
The journey from current reality to future vision is paved with data, collaboration, and clear visualization. When you invest in this discipline, you invest in the longevity of your operations. The maps guide you, but the people drive the bus. Ensure both are aligned.
Remember, the goal is not perfection. The goal is progress. Every map is a step toward a more efficient, resilient, and responsive organization. Keep refining, keep measuring, and keep moving forward. 🚀
