Operational efficiency is not about working faster; it is about understanding where the friction occurs. When teams move through tasks, certain stages inevitably create delays, errors, or redundancies. These friction points are known as bottlenecks. Identifying them requires a clear view of the entire workflow, not just individual tasks. This is where process mapping becomes an essential tool for operational analysis.
Using the Business Process Model and Notation (BPMN) standard allows organizations to visualize complex logic without ambiguity. It provides a common language for stakeholders to discuss flow, decision points, and handoffs. By mapping the “as-is” state accurately, teams can pinpoint exactly where value is lost. This guide details the methodology for leveraging process maps to uncover hidden inefficiencies.
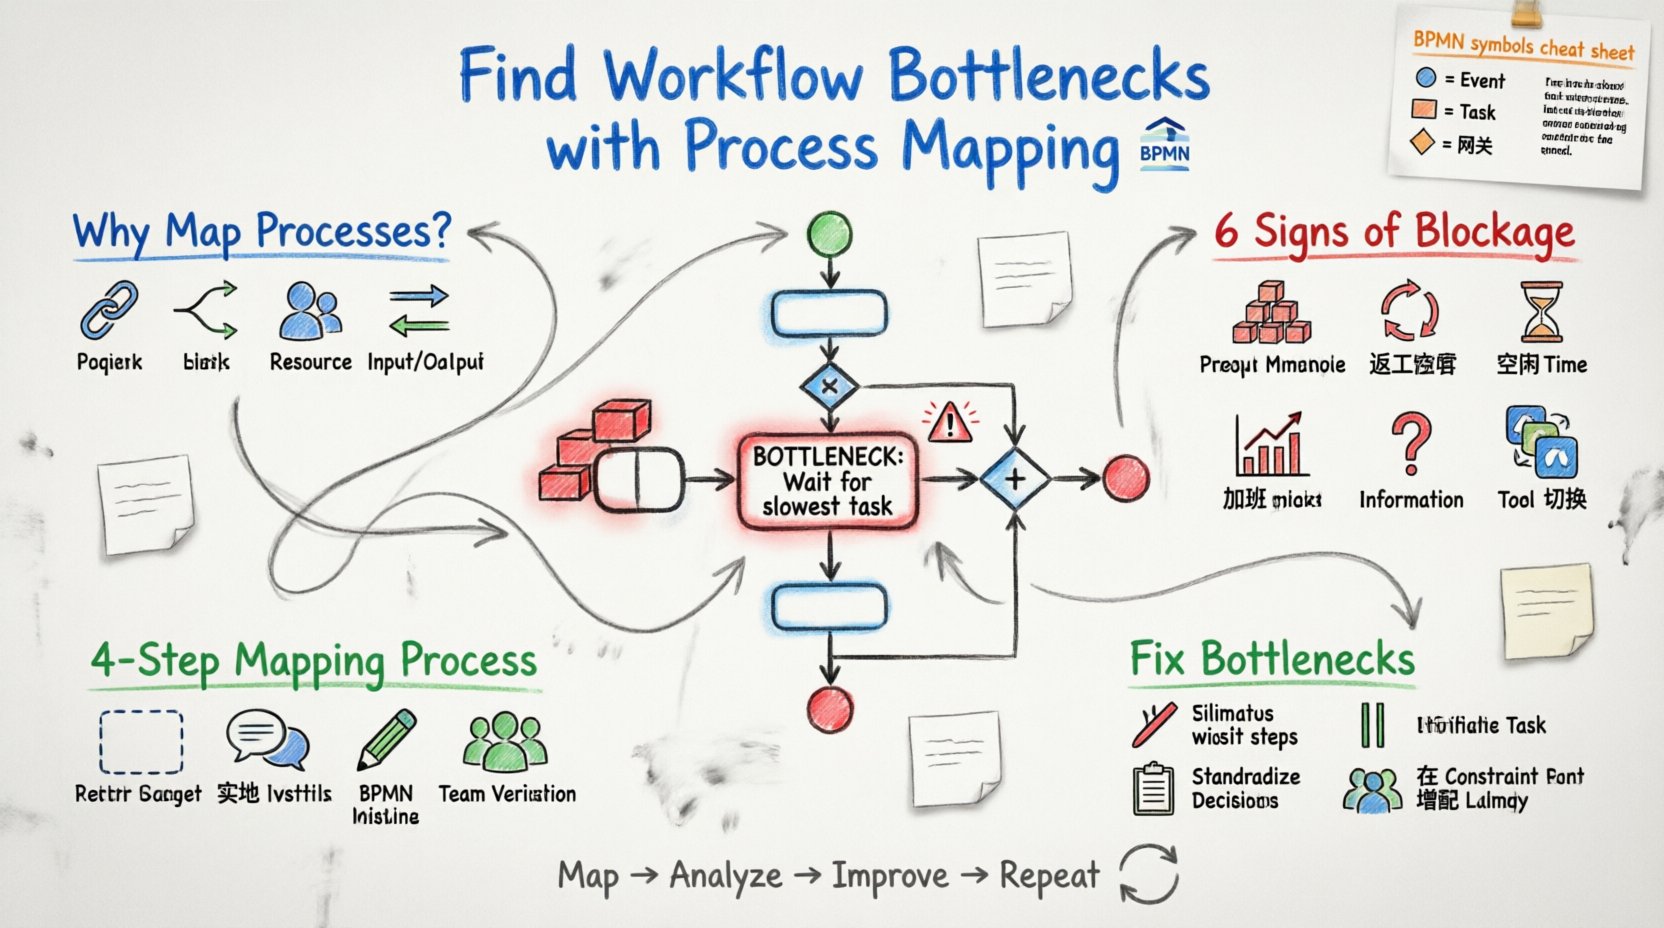
🧐 Why Process Visibility Matters
Without a visual representation of work, teams often rely on memory or anecdotal evidence. This leads to “heuristic” management, where decisions are based on what feels right rather than what the data shows. A process map acts as a single source of truth. It reveals:
- Sequence Dependencies: Which tasks must happen before others can begin.
- Decision Logic: Where the path splits based on conditions.
- Resource Allocation: Who is responsible for each step.
- Input/Output Flows: What data or materials enter and leave the process.
When you can see the entire chain, you stop guessing about delays. You start measuring them. A bottleneck is often hidden in plain sight, masked by the busyness of the surrounding activities. Mapping brings it into focus.
📐 Understanding BPMN in Context
BPMN is more than just drawing shapes. It is a notation system with specific rules. To identify bottlenecks effectively, you must understand what each symbol represents regarding flow and timing.
| Element | Visual Representation | Bottleneck Implication |
|---|---|---|
| Start Event | Circle (Green) | Triggers the process; delays here indicate intake issues. |
| Task | Rounded Rectangle | Work being performed; long durations suggest capacity limits. |
| Gateway | Diamond | Decision points; high branching complexity can slow flow. |
| Exclusive Gateway | Diamond with X | Only one path taken; logic errors here cause rework loops. |
| Inclusive Gateway | Diamond with O | Multiple paths taken simultaneously; resource contention risk. |
| Parallel Gateway | Diamond with + | Splits and joins flow; wait times occur at the join. |
| Intermediate Event | Circle with Inner Ring | Events during the process (e.g., timer); delays here affect timing. |
Recognizing these elements helps you diagnose where the process stalls. For example, a Parallel Gateway that splits work into five sub-tasks and rejoins them creates a synchronization point. The entire process cannot move forward until the slowest sub-task finishes. This is a classic bottleneck location.
🚧 Signs of a Workflow Blockage
Before drawing the map, you should look for symptoms that indicate a bottleneck exists. These signs often appear as complaints from team members or metrics that fail to meet targets.
- Queue Accumulation: Work items pile up before a specific person or department.
- Rework Loops: Tasks are sent back to previous steps due to errors or missing information.
- Idle Time: Upstream teams finish work but wait for downstream approval.
- Overtime Spikes: Specific roles consistently work beyond standard hours.
- Information Gaps: Stakeholders state they do not have the data needed to proceed.
- Tool Switching: Users constantly change applications to complete a single task.
When mapping, these symptoms become the focus of your investigation. You are looking for the visual evidence that supports these observations.
🛠️ Constructing the Map: Step-by-Step
Creating an accurate map requires preparation and collaboration. It is not a solitary activity. Here is the structured approach to building a reliable map.
1. Define the Scope and Boundaries
Every process has a beginning and an end. Clearly define where it starts and where it finishes. Do not try to map the entire company operations in one go. Pick a specific workflow, such as “New Client Onboarding” or “Invoice Processing”.
- Start Point: What triggers the process? (e.g., Customer submits a form).
- End Point: What defines completion? (e.g., Contract signed and filed).
- Boundaries: What is outside the scope? (e.g., Marketing activities prior to lead generation).
2. Gather Current State Data
Do not rely on the ideal version of events. Map what actually happens, including shortcuts and workarounds. Interview the people performing the tasks.
- Ask about exceptions: What happens when something goes wrong?
- Ask about timing: How long does this step actually take?
- Ask about inputs: What information is required to start?
- Ask about outputs: What is produced at the end of the step?
3. Draft the Diagram
Begin with the major steps and fill in the details. Use standard notation to ensure clarity. Avoid custom symbols that only you understand.
- Use tasks for specific actions.
- Use gateways for decisions.
- Use connectors to show flow direction.
- Label every connection clearly.
4. Validate with Stakeholders
Show the draft map to the people involved. Walk through the process together. Ask them to confirm if it matches their daily reality. This step is crucial for buy-in and accuracy.
- Walk through a specific case study.
- Identify missing steps or incorrect logic.
- Confirm who is responsible for each box.
- Verify the frequency of different paths.
🔍 Analyzing the Map for Bottlenecks
Once the map is drawn, you must analyze it to find the friction points. This involves looking at flow, load, and logic.
1. Visual Inspection
Look at the density of the diagram. Areas with many overlapping tasks or complex decision trees often indicate complexity that slows things down.
- Convergence Points: Where multiple paths join, work often piles up.
- Isolated Tasks: Tasks that require approval from someone not in the immediate chain.
- Loops: Any arrow that points backward indicates a potential error correction cycle.
2. Quantitative Analysis
Numbers tell the story that shapes cannot. Add data to your map to highlight capacity issues.
- Cycle Time: How long does each task take?
- Wait Time: How long does work sit before the next step?
- Volume: How many items pass through this step daily?
- Success Rate: What percentage of items pass without rework?
For example, if a task takes 2 hours but the queue before it has 50 items, that task is a bottleneck. If the queue is empty but the task takes 5 hours, that task might be a capacity issue, but not necessarily a bottleneck in terms of flow.
3. Identify Decision Complexity
Gateways create logic paths. If a single decision point splits the flow into 10 different paths, that is a high-risk area for delays. Complex logic often requires human judgment, which is slower than automated processing.
- Check if decisions can be automated.
- Check if rules are clear enough to be followed without hesitation.
- Check if too many people are involved in a single decision.
🛠️ Remediation Strategies
Finding the bottleneck is only half the battle. You must address it to improve performance. Here are common strategies for resolving identified issues.
1. Eliminate Non-Value Added Steps
Some steps exist only because of habit or outdated policy. If a step does not add value for the customer, consider removing it.
- Review every task for necessity.
- Ask: Does this step change the state of the work?
- Ask: Does this step provide information to the customer?
2. Parallelize Sequential Tasks
If tasks A, B, and C must happen in order, the total time is the sum of all three. If A, B, and C can happen at the same time, the total time is just the longest of the three.
- Identify tasks that do not depend on each other.
- Redesign the flow to allow simultaneous execution.
- Use Parallel Gateways to manage the split and join.
3. Standardize Decision Criteria
Reduce the cognitive load on decision-makers. If a choice is always the same for 90% of cases, automate it.
- Create clear rules for common scenarios.
- Limit the number of exceptions.
- Train staff on the new criteria to reduce hesitation.
4. Increase Capacity at Constraint Points
If a specific resource is the limit, you may need to add resources. However, ensure you add them where they are needed, not everywhere.
- Assign additional staff to the bottleneck task.
- Provide better tools or software for that specific step.
- Outsource the task if internal capacity is maxed out.
🔄 Maintaining Process Health
A process map is not a one-time deliverable. Workflows change. Staff changes. Customer needs evolve. To keep the benefits, you must maintain the map.
- Regular Reviews: Schedule quarterly reviews of key processes.
- Change Management: Update the map whenever a process change is implemented.
- Feedback Loops: Allow team members to suggest updates based on daily experience.
- Metrics Tracking: Monitor KPIs to see if the bottleneck has shifted.
Continuous improvement relies on continuous visibility. If the map becomes outdated, it becomes a liability rather than an asset. It will mislead you into optimizing the wrong areas.
🌐 Data Integration for Deeper Insights
While a visual map shows the logic, data integration shows the reality. Connecting your process map to actual execution data provides a powerful diagnostic tool.
- Timestamps: Record when each step starts and ends.
- Actor IDs: Track who performed each task.
- Error Codes: Log why a task failed or was rejected.
- Volume Counts: Measure how many items flow through each path.
When you overlay this data onto the map, you can see exactly where the time is spent. You can distinguish between “work time” and “wait time”. This distinction is critical for effective bottleneck identification.
🚀 Moving Forward with Clarity
Workflow inefficiency is rarely a mystery. It is usually a structural issue that becomes visible when you look at the whole picture. By using process mapping, specifically the BPMN standard, you create a framework for understanding your operations. This framework allows you to spot the blockages that slow down progress.
The goal is not perfection, but clarity. With a clear map, you can make informed decisions about where to invest effort. You can stop guessing and start optimizing. This approach leads to sustainable improvements in speed, cost, and quality. Focus on the process, not just the people. When the path is clear, the work flows.
