Project delivery is inherently uncertain. Every initiative carries the potential for delays, budget overruns, or scope creep. Project managers spend significant time anticipating these issues, yet traditional text-based documentation often fails to reveal hidden complexities. Visualizing workflows provides clarity. Process maps offer a structured way to see the entire journey of a task from initiation to completion. When applied correctly, these diagrams become powerful tools for risk mitigation.
Understanding the flow of work allows teams to spot bottlenecks before they become critical failures. This guide explores how project managers leverage process mapping standards, specifically within the context of Business Process Model and Notation (BPMN), to identify vulnerabilities and streamline execution. By visualizing the path, teams can navigate obstacles with precision.
🔍 What Is Process Mapping in a Project Context?
A process map is a visual representation of the steps involved in completing a specific task or workflow. It moves beyond a simple checklist to show the sequence, decision points, and stakeholders involved. In professional environments, these maps often adhere to standard notations to ensure universal understanding.
When discussing project management, the focus is often on Business Process Model and Notation (BPMN). This standard provides a graphical notation for specifying business processes in a business process model. It uses specific symbols to denote different types of activities:
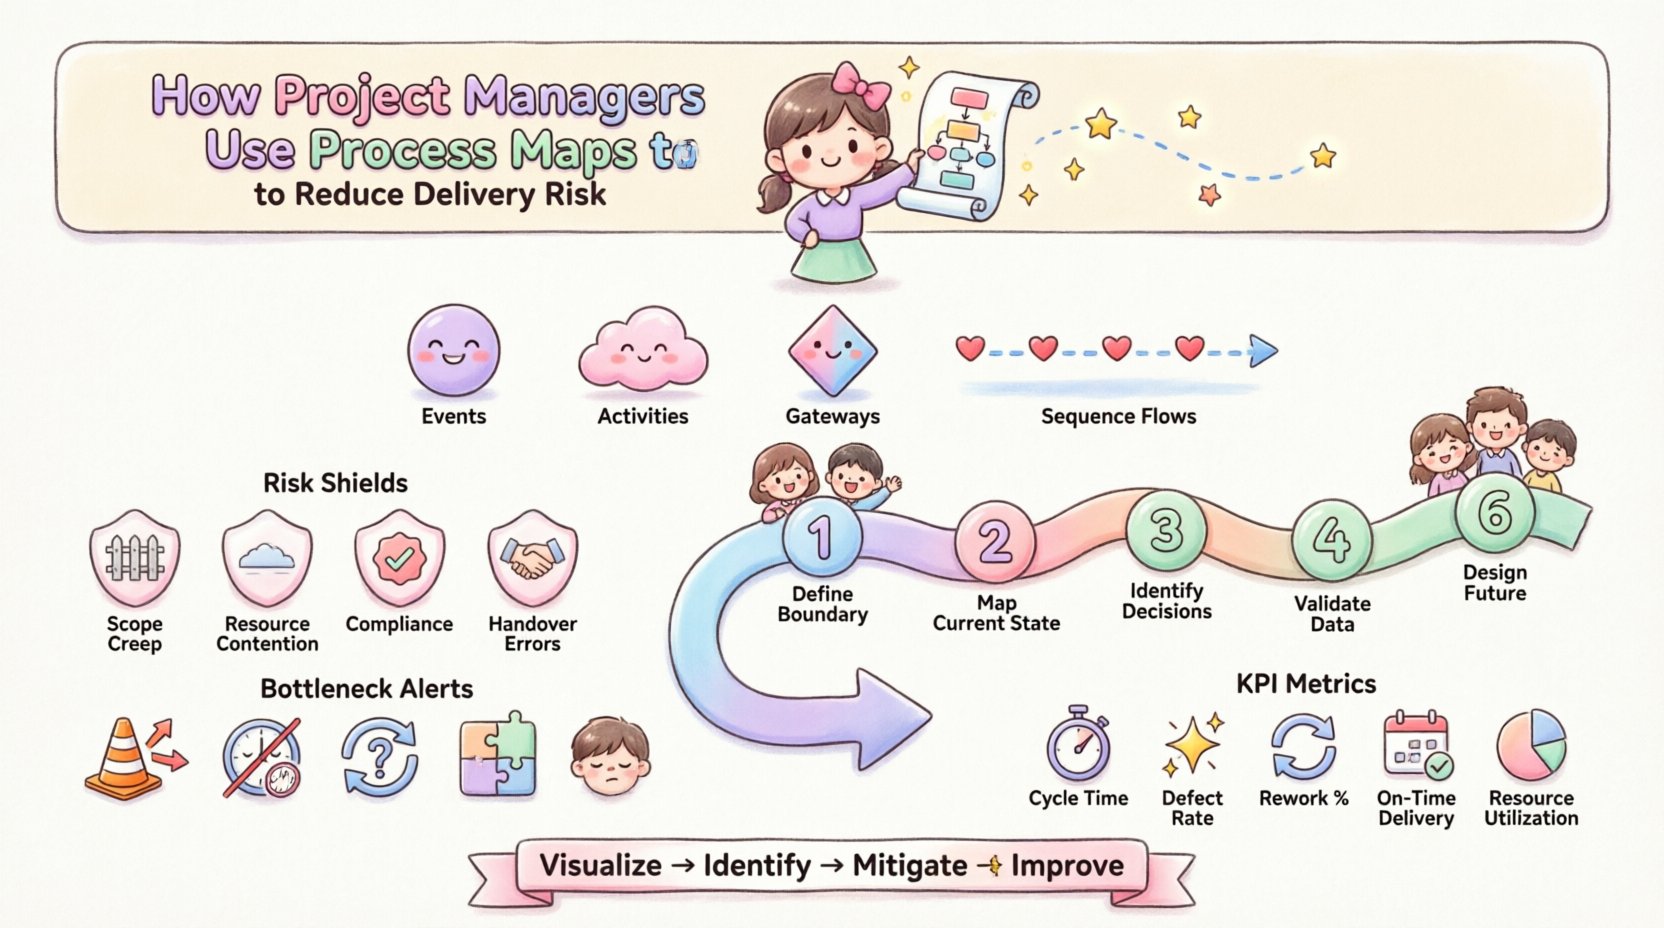
- Events: Things that happen (Start, End, Intermediate).
- Activities: The work being performed (Tasks).
- Gateways: Decision points (Yes/No, Approval required).
- Sequence Flows: The order in which tasks occur.
Using a standardized language like BPMN ensures that a developer, a stakeholder, and a project manager all interpret the diagram in the same way. This shared understanding is the first line of defense against miscommunication risks.
🛡️ Why Risk Reduction Matters in Projects
Risk is not just about avoiding failure; it is about ensuring predictability. Unpredictable projects strain resources, damage team morale, and erode client trust. Delivering on time and within budget requires a clear view of the operational landscape. Process maps address several core risk categories:
1. Scope Creep
Without a defined map, it is easy to add tasks that fall outside the original agreement. A map clearly delineates the start and end points of a process, making it easier to identify when a new request falls outside the standard path.
2. Resource Contention
Maps reveal where multiple tasks require the same resource simultaneously. If two critical paths converge on a single team member, the map highlights this dependency risk immediately.
3. Compliance and Quality
Regulatory requirements often dictate specific steps. A visual map ensures these mandatory checkpoints are not skipped, reducing the risk of audit failures or rework.
4. Handover Errors
Most project failures occur during transitions between teams or individuals. Process maps define exactly what is passed from one stage to the next, reducing the chance of information loss.
⚙️ Key Steps in Using Process Maps for Risk Mitigation
Creating a map is not a one-time event. It is a cycle of discovery, validation, and refinement. Project managers should follow a disciplined approach to ensure the map reflects reality.
- Define the Boundary: Clearly state where the process starts and ends. Is it from the initial client request to final delivery? Or just the development phase? Narrowing the scope prevents the map from becoming too complex to analyze.
- Gather the Right People: Involve the actual workers. They know where the delays happen. Stakeholders who are removed from the daily work often miss critical nuances.
- Map the Current State: Document how work actually flows, not how management thinks it flows. This “as-is” map often reveals hidden shortcuts or workarounds that create risk.
- Identify Decision Points: Highlight every gateway where a decision is made. These are the most common places for delays or errors.
- Validate with Data: Where possible, attach time estimates or error rates to specific tasks. A map without data is just a drawing.
- Design the Future State: Once risks are identified, map the ideal flow. Remove unnecessary steps and clarify ambiguous decisions.
🚧 Identifying Common Bottlenecks
Process maps excel at showing where work piles up. By analyzing the flow lines and connections, project managers can pinpoint structural weaknesses. The table below outlines common risk indicators found in process maps and their typical causes.
| Visual Indicator | Potential Risk | Root Cause |
|---|---|---|
| Multiple arrows converging on one task | Bottleneck / Delay | Single point of failure; resource overload |
| Diamond gateway with no defined output | Deadlock / Stagnation | Unclear decision criteria; missing approval path |
| Loops without a limit condition | Infinite Rework | Quality failure; lack of exit criteria |
| Parallel paths with no synchronization | Integration Failure | Teams working in silos; mismatched timelines |
| Long sequence of manual tasks | Human Error | Lack of automation; high cognitive load |
🤝 Improving Stakeholder Communication
One of the most significant risks in project management is the gap between technical execution and business expectation. Stakeholders often have different mental models of how a project should work. A process map acts as a single source of truth.
When a stakeholder asks, “Why is this taking so long?”, the project manager can point to the map. They can show the approval chains, the dependency on external data, or the specific testing phases. This transparency builds trust.
Key communication benefits include:
- Shared Vocabulary: Everyone agrees on what a “Task” or a “Gateway” means.
- Visual Evidence: It is harder to argue with a diagram than with a spreadsheet.
- Early Warning: Stakeholders see the impact of a change before it happens. If they want to add a step, they can see where it blocks the flow.
- Training Tool: New team members can learn the process by following the map rather than asking questions repeatedly.
🔄 Continuous Improvement via Process Maps
Projects are not static. The environment changes, requirements shift, and teams evolve. A process map is a living document. It should be updated as the project progresses. This practice supports a culture of continuous improvement.
When a risk materializes, the team should revisit the map. They need to ask: “Did the map show this coming?” If the answer is no, the map was incomplete. If the answer is yes, the mitigation plan was insufficient. This feedback loop strengthens future planning.
Integration with Project Lifecycle
Process mapping fits into various stages of the project lifecycle:
- Initiation: High-level maps help assess feasibility. Can we actually do this with current resources?
- Planning: Detailed maps inform the schedule and resource allocation. They ensure dependencies are captured.
- Execution: Maps guide the team through daily work. They serve as a reference for standard operating procedures.
- Closure: The final map represents the “As-Built” process. This is valuable for future projects and organizational knowledge bases.
📉 Measuring Success and Impact
How does a project manager know if process mapping is working? They need to measure specific metrics related to risk reduction. These metrics should be tracked before and after the implementation of the mapped process.
Key Performance Indicators (KPIs)
- Cycle Time: Does the time from start to finish decrease? Faster cycles often indicate fewer bottlenecks.
- Defect Rate: Are fewer errors occurring during the process? Clearer steps reduce mistakes.
- Rework Percentage: How much work needs to be done twice? Maps that clarify requirements reduce rework.
- On-Time Delivery: Does the percentage of milestones met on schedule improve?
- Resource Utilization: Is the workload distributed more evenly across the team?
⚠️ Common Pitfalls to Avoid
While powerful, process mapping has limitations. Project managers must avoid common mistakes that can introduce new risks or waste time.
- Over-Engineering: Do not map every single micro-step. High-level maps are often sufficient for strategic risk management. Too much detail can obscure the big picture.
- Static Documentation: If the map is created once and never updated, it becomes obsolete. Treat it as a dynamic tool.
- Ignoring Human Factors: A map might look perfect on paper but fail in practice due to team culture or fatigue. Always validate with the people doing the work.
- Using Maps as a Blame Tool: Do not use the map to find faults in individuals. Use it to find faults in the system. Blame creates fear and reduces honest reporting.
- Assuming Linearity: Real work is rarely a straight line. Allow for loops and exceptions in the map. A rigid linear map will break under pressure.
🛠️ Practical Application: The Approval Workflow
Consider a common project scenario: the approval workflow. This is a high-risk area because delays here stop all downstream work. A standard process map for approvals might look like this:
1. Start Event: Submission of deliverable.
2. Task: Automated Check (Format and completeness).
3. Gateway: Is it complete?
4. Path A (Yes): Route to Reviewer.
5. Path B (No): Return to Author.
6. Task: Reviewer provides feedback.
7. Gateway: Is it approved?
8. Path A (Yes): End Event (Approved).
9. Path B (No): Return to Author.
By mapping this, a manager can see that if the Reviewer is absent, the process stops. This identifies a single point of failure. The mitigation strategy is to define a backup reviewer within the map itself. This ensures the project does not stall.
📊 The Role of Data in Process Mapping
Visuals are important, but data gives them weight. When a project manager adds historical data to a process map, it transforms from a theoretical model to a predictive tool.
For example, if a specific task historically takes 5 days but the map assumes 2 days, the risk of schedule slippage is high. By annotating the map with actual performance data, the project manager can create more realistic schedules. This reduces the risk of committing to impossible deadlines.
Data also helps in resource leveling. If the map shows three tasks requiring the same specialized skill in the same week, the manager knows to hire a contractor or adjust the timeline. This proactive adjustment prevents the risk of burnout or delay.
🌐 Global and Distributed Teams
Modern projects often involve teams across different time zones. Communication latency is a major risk. Process maps help bridge this gap by defining clear handoff points.
Instead of vague instructions like “send this when ready,” a map specifies: “Task A ends when File X is uploaded to Folder Y. Task B starts when File X is downloaded by Team Z.” This clarity reduces the risk of lost files or misunderstood instructions across time zones.
📝 Final Thoughts on Process Discipline
Adopting process mapping requires discipline. It is not a magic fix, but it is a foundational practice for mature project management. It shifts the focus from reacting to problems to preventing them.
By investing time in visualizing the workflow, project managers gain control over the variables that matter most. They reduce the unknown, clarify the known, and create a roadmap that the entire team can follow. In an environment of constant change, this stability is invaluable.
Start small. Map one critical workflow. Identify the risks. Fix the process. Repeat. Over time, this discipline builds a resilient project organization capable of delivering consistent results.
