Effective teamwork relies heavily on how information is exchanged. In complex organizational environments, text-based instructions often lead to ambiguity. Different departments interpret requirements differently, causing delays and errors. To bridge this gap, organizations turn to shared process visuals. These diagrams serve as a single source of truth, aligning stakeholders across functions. When teams utilize standardized notation like BPMN, they create a common language that transcends departmental silos.
Building a collaborative culture requires more than just tools; it demands a shared understanding of workflows. Visual models allow team members to see the entire picture rather than isolated tasks. This perspective shifts focus from individual output to end-to-end value delivery. By adopting process visualization, teams reduce the friction caused by miscommunication and ensure everyone moves in the same direction.
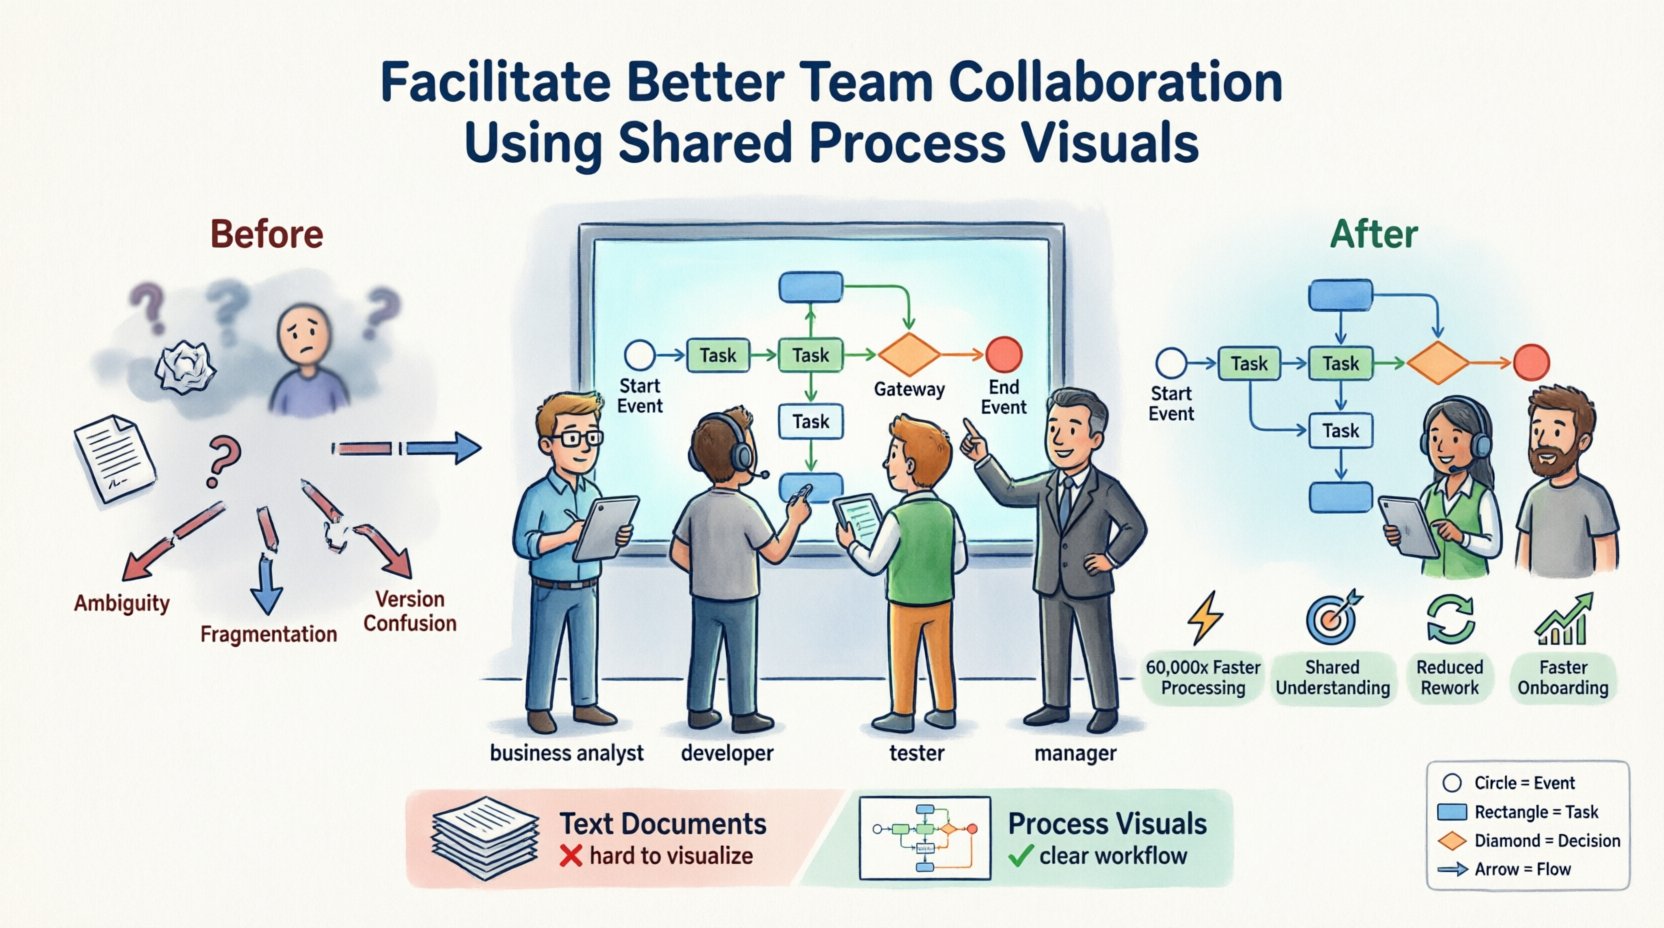
🧠 The Communication Gap in Modern Workflows
Communication breakdowns are a primary cause of project failure. When a business analyst writes a requirement document, a developer reads it, and a tester reviews it, nuances are often lost. Text is linear, but processes are often non-linear. They involve loops, decisions, and parallel activities. Describing these dynamics in paragraphs is inefficient and prone to error.
Consider a scenario where a customer request flows through multiple departments. If the handoff points are not clearly defined in text, work items sit idle. Teams may assume another group has completed a step when it has not. Shared process visuals eliminate this guesswork. A diagram explicitly shows where the process starts, where it branches, and where it ends. This clarity allows every participant to know their specific role within the larger system.
Key challenges in text-heavy workflows include:
- Ambiguity: Words like “soon” or “check” have different meanings to different people.
- Fragmentation: Information is scattered across emails, documents, and chat logs.
- Lack of Context: A task listed in isolation does not show how it connects to upstream or downstream activities.
- Version Confusion: Teams may work off outdated documents without realizing it.
👁️ Why Visuals Reduce Cognitive Load
The human brain processes images significantly faster than text. Research suggests that visual information is processed 60,000 times faster than text. When teams rely on diagrams, they reduce the mental effort required to understand a workflow. This reduction in cognitive load allows individuals to focus on problem-solving rather than deciphering instructions.
Visual models leverage spatial reasoning. Positioning elements on a page creates relationships between them. A box placed below another implies a sequence. An arrow pointing right indicates flow direction. These spatial cues are intuitive and require little training to interpret. For collaborative teams, this means new members can join a project and understand the process quickly without reading hundreds of pages of documentation.
Benefits of visual processing for teams:
- Faster Onboarding: New hires grasp the business logic through diagrams.
- Better Retention: Visual memory aids recall of process steps.
- Pattern Recognition: Teams spot bottlenecks or redundancies more easily in a diagram than in a spreadsheet.
- Reduced Meetings: A clear diagram can answer questions that would otherwise require a status meeting.
📐 BPMN as a Standardized Language
Not all visuals are created equal. Informal sketches can be useful, but they often lack precision. For large-scale collaboration, a formal standard is necessary. Business Process Model and Notation (BPMN) provides this standard. It is an internationally recognized method for modeling business processes. By adhering to BPMN standards, organizations ensure that a diagram created by one team can be understood by another.
BPMN defines specific symbols for different types of events. A circle represents an event. A rounded rectangle represents a task. A diamond represents a decision gateway. This consistency is crucial. If one team uses a square for a task and another uses a circle, the collaboration breaks down. Standardization ensures that the meaning of the visual elements remains constant regardless of who created them.
Adopting BPMN involves more than just drawing shapes. It requires understanding the semantics of the model. For instance, knowing the difference between a start event and an intermediate event helps teams understand triggers. Knowing the difference between a task and a sub-process helps teams understand scope. This semantic alignment is the foundation of effective process collaboration.
🗣️ Establishing a Shared Vocabulary
Visuals are only effective if the team agrees on what they represent. Before creating diagrams, teams must define their terminology. What constitutes a “task”? When does a process officially “start”? These definitions must be documented and agreed upon. Without this shared vocabulary, the same symbol might be interpreted differently by different departments.
Workshops are an effective way to build this shared understanding. Bringing representatives from IT, operations, and management together to review models fosters buy-in. During these sessions, the team discusses the flow of work. They identify gaps in the current process and agree on the future state. This collaborative approach ensures that the resulting visual reflects the reality of the work, not just the theory.
Key steps to establish a shared vocabulary:
- Define Roles: Clearly identify who owns the process and who executes the tasks.
- Standardize Naming: Use consistent naming conventions for events and activities.
- Clarify Rules: Document the business rules that govern decision gateways.
- Review Cycles: Schedule regular reviews to ensure the vocabulary remains relevant.
⚖️ Governance and Maintenance Strategies
A process model is a living document. It requires maintenance to remain accurate. Without governance, diagrams become outdated quickly. Teams might continue to follow a process that has changed, leading to inefficiencies. Governance structures ensure that changes to the process are documented and approved before implementation.
Effective governance does not mean bureaucracy. It means having clear ownership. One person or group should be responsible for updating the models. When a change occurs in the business, the model must be updated to reflect it. This synchronization between the real world and the diagram is critical. If the model is wrong, it becomes a source of confusion rather than clarity.
Strategies for maintaining visual accuracy:
- Version Control: Track changes to models over time to understand the evolution of the process.
- Access Control: Ensure only authorized personnel can modify the core process definitions.
- Notification Systems: Alert relevant stakeholders when a process model is updated.
- Integration: Link models to documentation or training materials to keep them relevant.
🚧 Common Pitfalls in Process Modeling
Creating process visuals is a skill that improves with practice. However, teams often make mistakes that reduce the value of the diagrams. One common error is over-complication. Trying to model every single step in excruciating detail can make the diagram unreadable. The goal is clarity, not completeness. Teams should focus on the high-level flow and drill down into details only when necessary.
Another pitfall is creating models in isolation. When a process owner designs a workflow without input from the people who actually do the work, the model fails to capture reality. This leads to resistance and low adoption. Collaboration in the modeling phase is just as important as collaboration in the execution phase.
Common modeling errors to avoid:
- Swimlane Confusion: Mixing up which department performs which task.
- Missing Exceptions: Forgetting to model what happens when things go wrong.
- Inconsistent Detail: Some parts of the process are detailed while others are vague.
- Static Models: Creating a diagram that is never updated after the initial launch.
📊 Measuring the Impact of Visual Alignment
Organizations need to know if the investment in process visualization is paying off. Metrics help quantify the benefits of improved collaboration. Teams should track indicators related to efficiency, error rates, and satisfaction. If the introduction of shared visuals leads to faster project completion, the strategy is working.
Quantitative metrics provide hard data. Qualitative feedback provides context. Combining both gives a complete picture of the collaboration health. Regular surveys can gauge how well team members understand the workflows. Cycle time analysis can show if bottlenecks are being resolved through better visibility.
Key performance indicators to track:
- Process Cycle Time: How long does it take to complete a workflow from start to finish?
- Rework Rates: How often does work need to be redone due to misunderstanding?
- Adoption Rate: How many team members actively use the process visuals?
- Issue Resolution Time: How quickly are process blockers identified and fixed?
🤝 Comparison of Communication Methods
Different methods suit different needs. Understanding when to use a visual versus text helps optimize communication. The table below outlines the strengths and weaknesses of various approaches.
| Method | Best For | Weaknesses |
|---|---|---|
| Text Documents | Detailed rules, legal requirements | Hard to visualize flow, prone to misinterpretation |
| Email Chains | Quick updates, informal chats | Fragmented, lacks context, hard to search |
| Process Visuals | Workflow alignment, training, high-level overview | Requires maintenance, can be complex if over-detailed |
| Spreadsheets | Data tracking, lists of items | Poor at showing logic or sequence |
🔑 BPMN Symbols for Team Context
Understanding the basic symbols is essential for reading and creating models. The table below highlights the most common elements used in collaborative settings.
| Symbol Shape | Name | Purpose in Collaboration |
|---|---|---|
| Circle (Thin) | Start Event | Indicates where the process begins |
| Circle (Thick) | End Event | Indicates where the process finishes |
| Rounded Rectangle | Task | A specific piece of work to be done |
| Diamond | Gateway | A decision point or branching logic |
| Arrow | Sequence Flow | Shows the order of steps |
🔄 Final Considerations for Implementation
Implementing shared process visuals is a journey. It requires patience and commitment from leadership. The initial phase may feel slow as teams learn the new notation. However, the long-term benefits of reduced friction and improved alignment are significant. Organizations that prioritize visual clarity create a foundation for agility.
Success depends on continuous improvement. Teams should regularly review their models to see if they still reflect current operations. As the business evolves, the visuals must evolve with it. This dynamic approach ensures that the diagrams remain a useful tool rather than a static archive.
By focusing on shared understanding and standardized notation, teams can transform how they work. The goal is not just to draw diagrams, but to build a culture of clarity. When everyone sees the same picture, they can work together more effectively toward common goals.

