In the modern landscape of project management, intuition alone is no longer sufficient for steering complex initiatives to success. The volume of information generated during a project lifecycle is immense, yet without a structured approach to interpretation, this data remains underutilized. Data-driven decision making represents a fundamental shift from reactive management to proactive strategy. It involves collecting, analyzing, and applying quantitative information to guide project direction, resource allocation, and risk mitigation. By prioritizing evidence over anecdote, project leaders can significantly reduce uncertainty and improve delivery outcomes.
This guide explores the mechanics of transforming raw project metrics into strategic assets. We will examine the essential indicators that define project health, discuss methods for accurate data collection, and outline processes for converting analysis into concrete actions. Whether you are managing a small team or a large-scale enterprise initiative, understanding the relationship between data and decision-making is critical for sustainable performance.
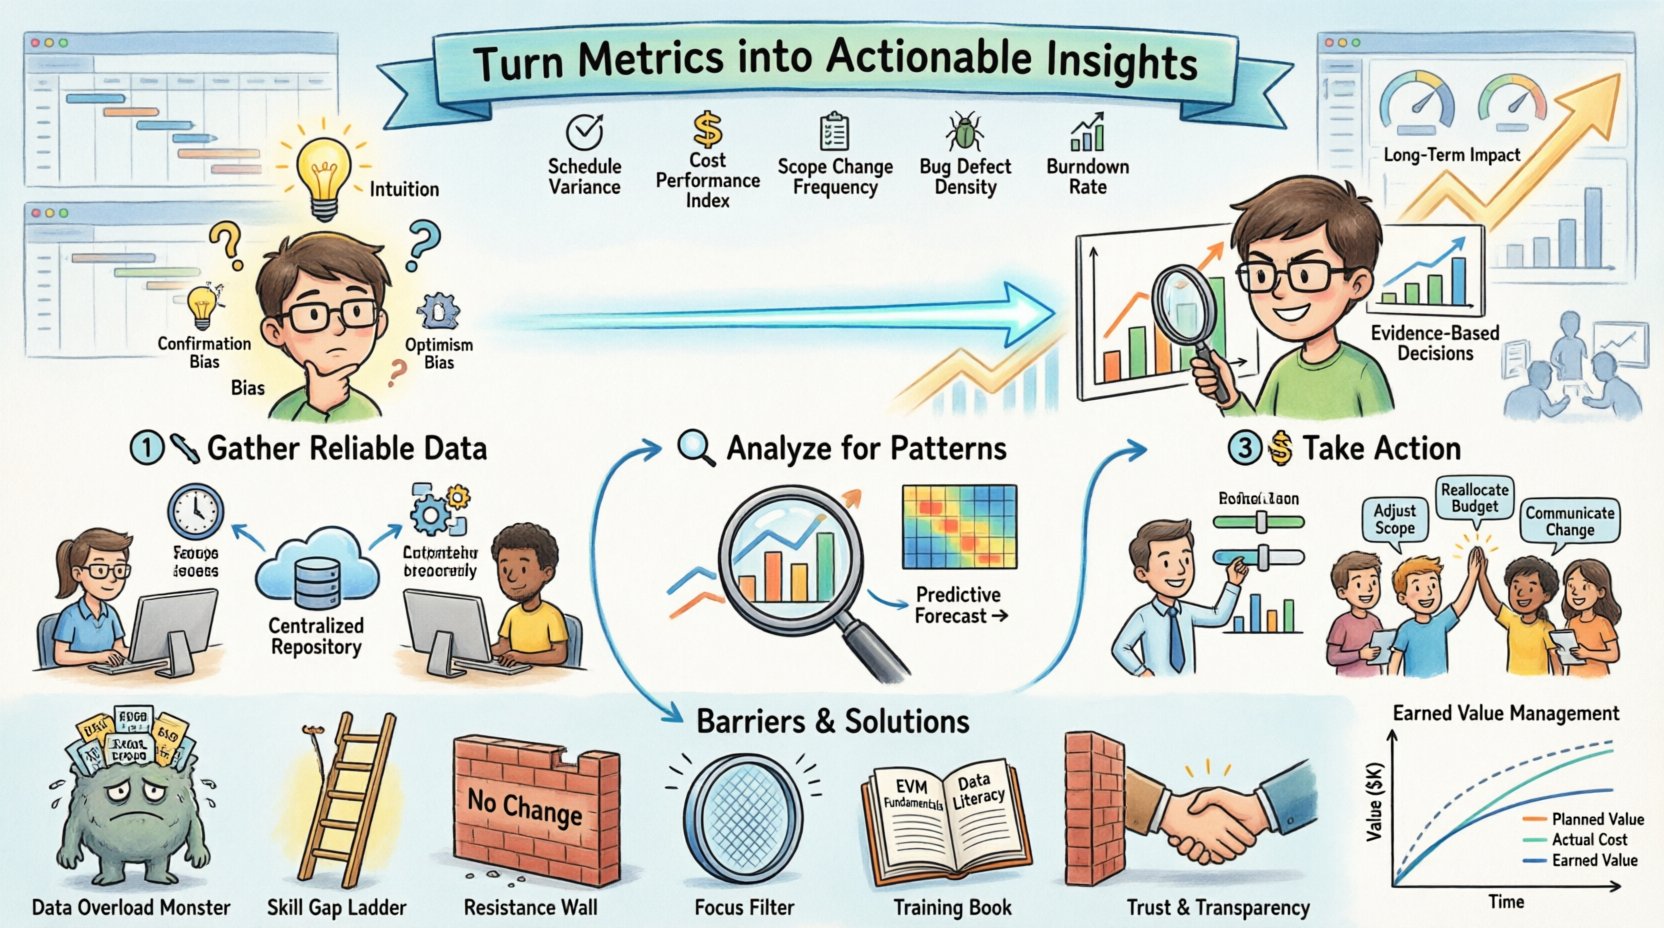
The Shift from Intuition to Evidence 🧠➡️📈
Historically, project management relied heavily on the experience and judgment of the project manager. While experience remains valuable, it is prone to cognitive biases such as confirmation bias or optimism bias. When decisions are based solely on gut feelings, critical warning signs often go unnoticed until it is too late to course-correct. Adopting a data-centric approach mitigates these risks by introducing objective benchmarks.
The core benefit of this shift is clarity. Data provides a common language for stakeholders, developers, and leadership to discuss progress. It removes ambiguity regarding status. Instead of stating a task is “almost done,” metrics can show exactly how many hours were logged versus the baseline estimate. This precision fosters trust and allows for more honest conversations about challenges.
- Reduced Bias: Objective numbers prevent personal preferences from skewing resource allocation.
- Early Warning Systems: Trends in velocity or burn rate can signal delays weeks before a deadline is missed.
- Accountability: Clear metrics define what success looks like for every team member.
- Continuous Improvement: Historical data allows teams to refine estimates for future projects based on actual performance.
Core Metrics Every Project Manager Needs 🎯
To make effective decisions, one must first know which metrics matter. Tracking every available number leads to analysis paralysis. Instead, focus on key performance indicators (KPIs) that directly correlate with project success. These metrics generally fall into categories of time, cost, scope, and quality. Selecting the right mix depends on the specific goals of the initiative.
| Category | Metric | What It Measures | Why It Matters |
|---|---|---|---|
| Time | Schedule Variance (SV) | Deviation from planned schedule | Indicates if the project is ahead or behind timeline. |
| Cost | Cost Performance Index (CPI) | Efficiency of budget usage | Shows if you are getting value for every dollar spent. |
| Scope | Scope Change Frequency | Rate of requirement changes | High frequency suggests instability in requirements. |
| Quality | Bug Defect Density | Errors per unit of work | High density may indicate rushed development or technical debt. |
| Resource | Burndown Rate | Work remaining over time | Visualizes progress toward completion within a sprint or phase. |
Understanding Earned Value Management (EVM)
Earned Value Management is a robust methodology for measuring project performance. It integrates scope, schedule, and cost to provide a complete picture. Rather than looking at these factors in isolation, EVM calculates the value of work actually performed compared to what was planned. This allows managers to calculate forecasts for the final cost and completion date based on current trends.
For example, if a project is 50% complete but has only spent 60% of the budget, the data suggests a potential surplus or a delay in deliverables. If the budget spent is 40% for 50% work, the project is under budget but potentially behind schedule. These nuances are invisible without a structured framework.
Gathering Reliable Data 📥
The quality of a decision is directly tied to the quality of the data available. If the input is flawed, the output will be misleading. This concept is often summarized as “garbage in, garbage out.” Ensuring data integrity requires discipline in logging and reporting. Team members must understand the importance of accurate time tracking and status updates.
Best Practices for Data Collection
- Standardize Inputs: Define clear categories for time logging and task status. Avoid vague labels like “working on” and use specific identifiers like “coding module X”.
- Automate Where Possible: Manual entry is prone to human error and forgetfulness. Where feasible, integrate systems to capture data automatically from development environments or task boards.
- Regular Audits: Periodically review data logs to ensure consistency. Check for outliers that might indicate data entry mistakes.
- Contextualize Data: Numbers without context are meaningless. Always record the circumstances surrounding a metric, such as unexpected holidays or resource unavailability.
Avoiding Data Silos
Data often gets trapped in separate departments. The finance team may have budget data, while the engineering team holds velocity data. If these datasets do not communicate, the project manager cannot see the full financial impact of technical decisions. Establishing a central repository for project data ensures that all stakeholders are working from the same source of truth. This transparency prevents conflicting reports and ensures alignment across the organization.
Analyzing for Patterns 🔍
Collecting data is only the first step. The real value lies in analysis. Raw numbers do not make decisions; insights derived from those numbers do. Analysis involves looking for trends, correlations, and anomalies over time. It requires asking questions of the data to understand the underlying narrative of the project.
Variance Analysis
Variance analysis compares planned performance against actual performance. Significant variances trigger deeper investigation. A negative variance in schedule might be due to a specific bottleneck in the workflow, while a positive variance in cost might indicate that estimates were overly conservative. Identifying the root cause is essential before taking action.
- Identify the Trend: Is the variance a one-time event or a recurring pattern?
- Isolate the Variable: What changed in the process when the variance occurred?
- Assess Impact: How does this variance affect the critical path of the project?
Predictive Insights
Advanced analysis moves beyond looking at what happened to predicting what will happen. By applying statistical methods to historical performance, project managers can forecast completion dates and budget requirements with greater accuracy. This allows for early intervention strategies. If the data suggests the project will finish two weeks late, stakeholders can be informed immediately, allowing for scope adjustments or resource additions.
From Insight to Execution 💪
An insight is useless if it does not lead to action. The transition from analysis to execution is where many projects lose momentum. Managers must establish clear protocols for responding to data findings. When a metric crosses a threshold, there must be a predefined response plan.
Actionable Scenarios
| Insight | Immediate Action | Strategic Adjustment |
|---|---|---|
| Burndown is flatter than planned | Review current task assignments | Reallocate resources or reduce scope |
| CPI drops below 1.0 | Identify cost drivers | Renegotiate vendor contracts or trim budget |
| Defect density spikes | Pause new feature development | Initiate a dedicated quality improvement sprint |
| Team velocity fluctuates | Check for blockers | Implement training or adjust sprint length |
Communication is Key
When acting on data, communication must be transparent. Share the metrics with the team and the reasoning behind the decision. This prevents the perception that management is acting arbitrarily. When team members understand the data behind a decision, they are more likely to support the change. It turns data into a shared tool for problem-solving rather than a weapon for oversight.
Barriers to Implementation 🛑
Despite the clear benefits, implementing a data-driven culture faces hurdles. Resistance to change is common, especially among team members who prefer traditional methods. There may also be concerns about privacy or the feeling of being monitored. Addressing these concerns is vital for success.
- Overload: Collecting too much data can overwhelm the team. Focus on the vital few metrics that drive the project forward. Avoid vanity metrics that look good but do not influence decisions.
- Lack of Skills: Not every project manager is a data analyst. Provide training on basic analytics and interpretation. Ensure the team knows how to read the reports they are generating.
- Data Hygiene: Inconsistent data entry undermines trust in the system. Enforce standards and make data entry as easy as possible to maintain accuracy.
- Resistance: Frame data as a tool for support, not surveillance. Emphasize that the goal is to remove obstacles and help the team succeed, not to punish delays.
Fostering a Data-Conscious Team 🤝
Sustainable data-driven decision making requires a cultural shift. It cannot be imposed from the top down without engagement. The entire team needs to understand how their daily work contributes to the data pool and how that data influences the project trajectory.
Building the Habit
Start by incorporating data reviews into regular meetings. Instead of just asking “How are things?”, ask “What does the data tell us about our velocity this week?” This normalizes the use of metrics in conversation. Over time, team members will begin to anticipate these questions and track their own progress more carefully.
Iterative Refinement
Just like the project itself, the metrics system should evolve. Regularly review the dashboard and reporting structure. Are the metrics still relevant? Are they changing? As the project moves from planning to execution to closure, different data points become more important. Adapt the measurement strategy to match the current phase of the lifecycle.
Long-Term Impact on Organizational Health 🌱
The benefits of data-driven management extend beyond the current project. Historical data creates a knowledge base that improves future planning. When a company completes multiple projects using consistent metrics, patterns emerge that inform organizational strategy. Budgets become more accurate, timelines become more realistic, and risk profiles become better understood.
This institutional knowledge reduces the learning curve for new projects. New teams can reference past performance data to set baselines. This continuity leads to higher predictability and stability across the organization. Ultimately, the goal is to create a cycle where every project informs the next, driving continuous improvement in efficiency and quality.
By treating data as a strategic asset, project managers can navigate complexity with confidence. The path forward is not about eliminating uncertainty, but about managing it with precision. Through disciplined measurement, thoughtful analysis, and decisive action, teams can turn raw numbers into a roadmap for success.

