Business processes drive organizations. They define how work gets done, how value is delivered, and how teams collaborate. To communicate these processes effectively, a standardized language is required. That language is Business Process Model and Notation, commonly known as BPMN 2.0. This guide provides a deep dive into the core concepts, ensuring you build a solid foundation for process modeling without relying on specific tools or software products.
🏗️ Understanding BPMN 2.0: The Standard for Process Visualization
BPMN 2.0 is an open standard maintained by the Object Management Group (OMG). Its primary purpose is to create a bridge between business analysis and technical implementation. It allows stakeholders to understand processes visually before any code is written or systems are configured.
- Visual Clarity: Diagrams are intuitive for business users.
- Technical Precision: The notation includes details required for execution engines.
- Universal Understanding: A shared vocabulary across departments.
When you start modeling, the goal is clarity. You are documenting a flow of activity. Every symbol you choose carries specific meaning regarding time, state, and action. Ignoring these definitions can lead to ambiguity, which defeats the purpose of the standard.
🔑 Core Concepts to Remember
Before drawing lines, understand the scope. A process is a series of steps that leads to a result. BPMN represents this sequence. It distinguishes between the what (the activity) and the when (the timing and triggers).
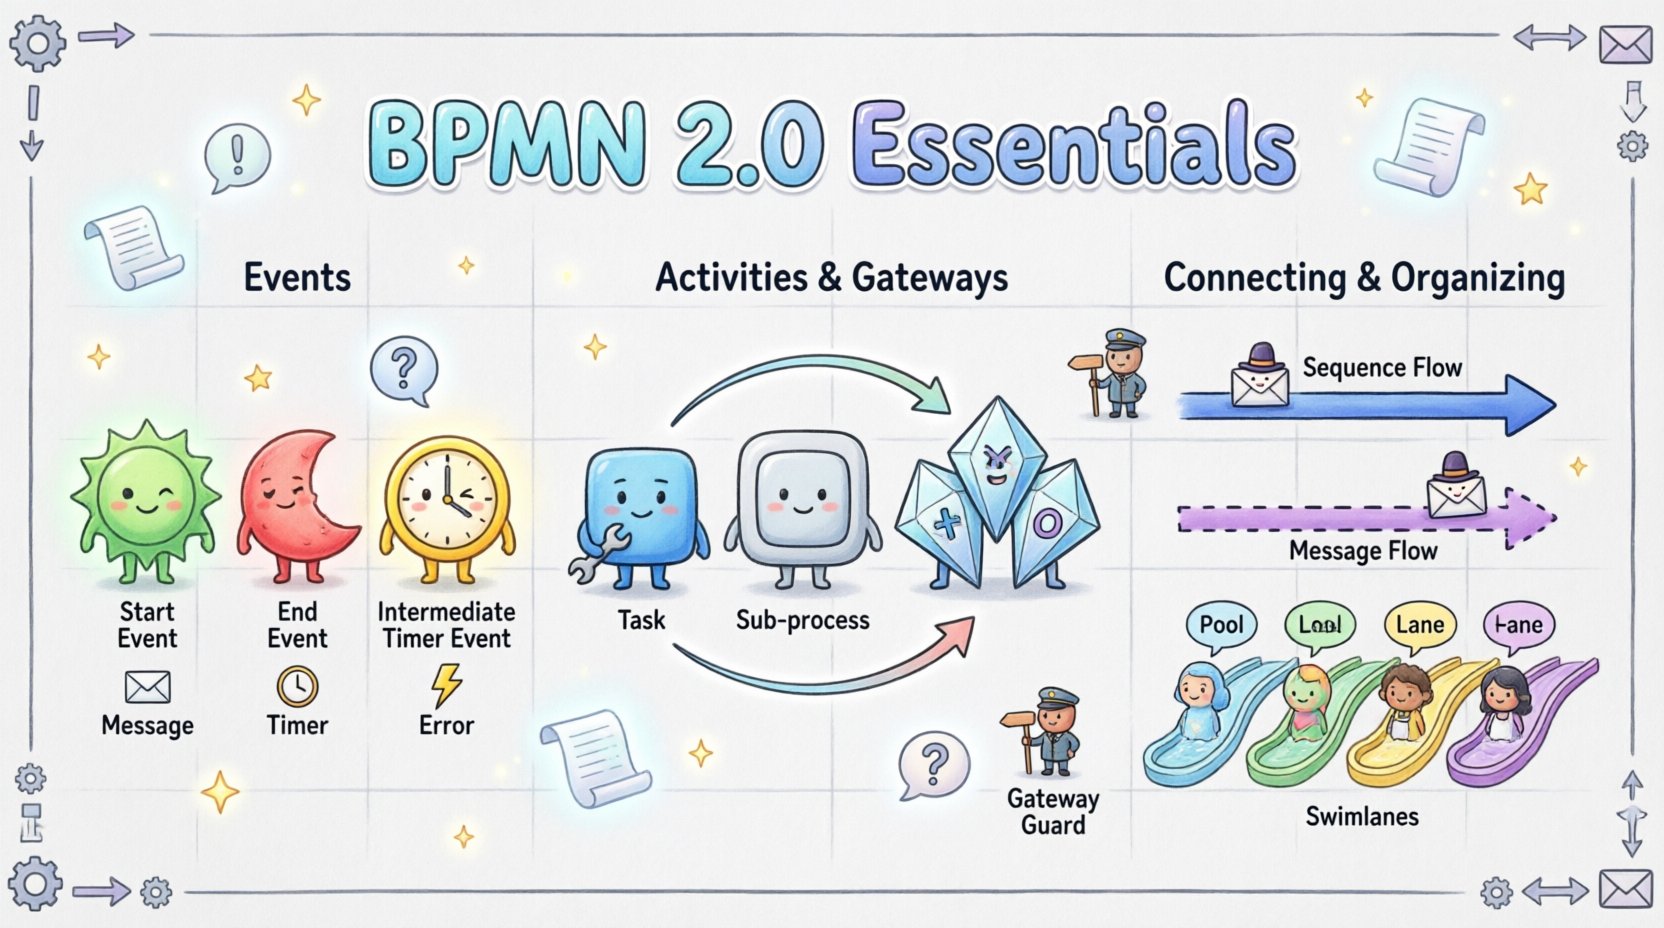
⚡ The Building Blocks: Events, Activities, and Gateways
The diagram consists of four main categories of objects. Mastering these shapes is the first step toward competency.
1. Events: The Triggers and Outcomes
Events represent something that happens during a process. They are the start, the middle, and the end of the flow. Visually, they are circles.
- Start Events: Represent the trigger that initiates the process. These are usually single-bordered circles. They do not have incoming flow.
- End Events: Represent the termination of the process. They have outgoing flow but no incoming flow.
- Intermediate Events: Occur between the start and the end. They can delay a process, listen for a signal, or catch a message.
Events can be categorized by their behavior:
- Message Events: Interaction with external entities (e.g., receiving an email).
- Timer Events: Waiting for a specific time or duration (e.g., “Wait 2 days”).
- Error Events: Handling failures or exceptions within the flow.
2. Activities: The Work Being Done
Activities represent work that happens within the process. They are drawn as rounded rectangles.
- Tasks: The smallest unit of work. A task has no sub-structure visible in the diagram. It is a single action.
- Sub-processes: A task that contains its own internal flow. This allows for abstraction. You can zoom out to see the high-level process or zoom in to see the details.
- Call Activities: A reference to a process defined elsewhere. It does not draw the internal flow but calls an existing one.
3. Gateways: The Decision Points
Gateways control the divergence and convergence of the flow. They determine which path the process takes next. They are drawn as diamonds.
Understanding gateways is critical. Misusing them leads to logic errors. The following table outlines the most common types.
| Gateway Type | Symbol Shape | Function |
|---|---|---|
| Exclusive Gateway | ⚪ Diamond with X | One path is chosen out of many. (If/Else logic) |
| Parallel Gateway | ⚪ Diamond with + | All paths continue simultaneously. (And logic) |
| Inclusive Gateway | ⚪ Diamond with O | One or more paths can be chosen based on conditions. |
| Event-based Gateway | ⚪ Diamond with Circle | Waits for an event to happen before proceeding. |
🔗 Connecting the Elements: Sequence and Message Flow
Lines connect the objects. The type of line defines the relationship between the connected elements.
Sequence Flow
Sequence flow represents the order of activities within a single process. It is a solid line with an arrowhead.
- Direction: Flow goes from left to right or top to bottom generally.
- Boundary: It exists only inside a Pool (or a Sub-process).
- Logic: It implies a direct dependency. Step B cannot start until Step A is complete.
Message Flow
Message flow represents communication between participants. It is a dashed line with an open arrowhead.
- Context: Used between different Pools or between a Pool and a Lane.
- Interaction: Indicates a message sent from one entity to another.
- Timing: Unlike sequence flow, the receiving side might not be ready immediately.
Do not confuse these two. Using a sequence flow to connect two different pools is a modeling error. Using a message flow within a single process is also incorrect.
🏊 Organizing Complexity: Pools and Lanes
As processes grow, they become complex. Pools and Lanes provide the structure to manage this complexity.
Pools
A Pool represents a participant in the process. It could be an entire organization, a specific department, or a system. It defines the boundaries of the process.
- A process diagram can have multiple Pools to show interactions between different organizations.
- Each Pool has its own internal context.
Lanes
Lanes divide a Pool into functional areas. They represent roles, departments, or systems within the participant.
- Role Assignment: Activities are placed in the lane of the role responsible for them.
- Swimlanes: This visual layout is often called swimlanes because the flow “swims” across them.
- Clarity: Lanes prevent the diagram from becoming a tangled mess by grouping related tasks.
When drawing, keep activities within their assigned lanes. Crossing lanes with sequence flow is allowed but should be minimized to maintain readability.
📊 Data and Artifacts
Processes do not exist in a vacuum. They manipulate data and require documentation.
Data Objects
Data objects represent the information consumed or produced by an activity. They are drawn as a document icon.
- Input: An activity needs a document to proceed.
- Output: An activity creates a new document.
- Association: Connect the data object to the relevant task using a dashed line.
Groups
Groups are used to visually cluster activities without changing the flow logic. They are drawn as a rectangle with a folded corner.
- Annotation: Use groups to add context or notes to a section of the diagram.
- Scope: A group does not affect the execution order. It is purely for presentation.
Text Annotations
Annotations allow you to add explanatory text to specific parts of the diagram. This is useful for defining business rules or constraints.
- Connect the annotation to the relevant object.
- Keep the text concise.
- Use this for clarifying conditions on gateways.
🛠️ Best Practices for Clean Modeling
Creating a diagram is one thing; creating a readable, maintainable one is another. Follow these guidelines to ensure your models are effective.
- Keep it Simple: If a diagram is too crowded, break it down into sub-processes.
- Consistent Naming: Use clear, action-oriented names for tasks (e.g., “Review Application” instead of “App”).
- Directional Flow: Maintain a consistent reading direction (top-left to bottom-right).
- Avoid Crossing Lines: Crossing lines make the diagram hard to trace. Adjust the layout to minimize intersections.
- Use Gateways Correctly: Ensure every gateway has a corresponding incoming and outgoing path where applicable.
- Balance the Flow: If using an Exclusive Gateway, ensure all paths eventually converge at a point or end.
⚠️ Common Pitfalls to Avoid
Even experienced modelers make mistakes. Recognizing these errors early saves time during implementation.
1. Orphaned Gateways
A gateway without an incoming or outgoing flow breaks the process. Every path must lead somewhere. If a path ends unexpectedly, the process logic is flawed.
2. Infinite Loops
Ensure that loops have a termination condition. A process that runs forever is a failure. Use Timer Events or specific conditions to break the loop.
3. Mixing Flow Types
Do not mix Sequence Flow and Message Flow on the same line. Use the correct line style for the context (internal vs. external).
4. Ignoring Error Handling
Real-world processes encounter errors. Include Error Intermediate Events to show how the process recovers from failures. Do not assume everything goes smoothly.
🔍 Deep Dive: Advanced Gateway Logic
Gateways are the most complex part of BPMN. Let’s explore the logic in more detail.
Exclusive Gateway (XOR)
This is the standard decision point. Only one path is taken. The conditions on the outgoing flows must be mutually exclusive.
- Example: Is the customer VIP? Yes → Send Priority Email. No → Send Standard Email.
- Requirement: Conditions must cover all possibilities to avoid dead ends.
Parallel Gateway (AND)
This splits the flow into multiple concurrent paths. All paths are executed immediately.
- Example: Send Email AND Update Database.
- Convergence: A Parallel Gateway is also used to wait for all incoming paths to complete before continuing.
Inclusive Gateway (OR)
This allows for one or more paths to be taken. It is more flexible than Exclusive.
- Example: Send Email AND/OR Send SMS.
- Logic: The conditions determine which specific combinations are valid.
📈 Implementing BPMN in Your Organization
Adopting BPMN requires a cultural shift. It is not just about drawing diagrams; it is about standardizing communication.
- Training: Ensure all stakeholders understand the symbols.
- Governance: Establish rules for who can model and who approves the models.
- Version Control: Treat process models like code. Keep track of changes over time.
- Review Cycles: Regularly review models to ensure they match current reality.
🧭 Final Considerations
BPMN 2.0 is a robust tool for representing business logic. It is not a silver bullet, but it provides the structure needed for clear communication. By understanding the symbols, the flow types, and the organizational structures, you can create models that are both accurate and useful.
Start small. Model a single, simple process. Get comfortable with the shapes. Then expand to more complex scenarios. The standard is designed to be scalable. Whether you are mapping a simple approval flow or a global supply chain, the fundamentals remain the same.
Focus on accuracy over aesthetics. A clean diagram is good, but a correct one is essential. Use the guidelines provided here to ensure your processes are modeled with precision. With practice, the notation becomes second nature, allowing you to focus on the logic and the value of the process itself.

