


Imagine transforming a complex, data-heavy process improvement project into a streamlined, AI-guided journey. The Lean Six Sigma DMAIC Framework Tool from Visual Paradigm makes this a reality, enabling professionals to systematically tackle business challenges with unprecedented speed and precision. This powerful, AI-powered application guides users through the entire DMAIC (Define, Measure, Analyze, Improve, Control) methodology, turning a daunting task into a clear, step-by-step process. By simply inputting your business context and problem, the tool leverages AI to generate a comprehensive project plan, from defining the problem to creating a professional final report. This article provides a deep dive into how this innovative tool works, using a real-world example of a medical billing service to demonstrate its capabilities. Discover how you can leverage this AI-powered Lean Six Sigma tool to drive significant, data-driven improvements in your organization.
-
Quick Summary
-
The AI-Powered Lean Six Sigma DMAIC Framework Tool automates the creation of a complete improvement project using a guided 6-step wizard.
-
It uses AI to generate a structured project plan based on your business context, saving significant time and effort.
-
Users can manually define project details or use AI to generate a full draft, which can then be edited and refined.
-
Key features include dynamic tables for data input, local project saving for privacy, and a consolidated final report for sharing.
-
It is ideal for process improvement specialists, project managers, and quality teams seeking a structured, data-driven approach to problem-solving.
-
From Problem to Plan: The AI-Powered Workflow
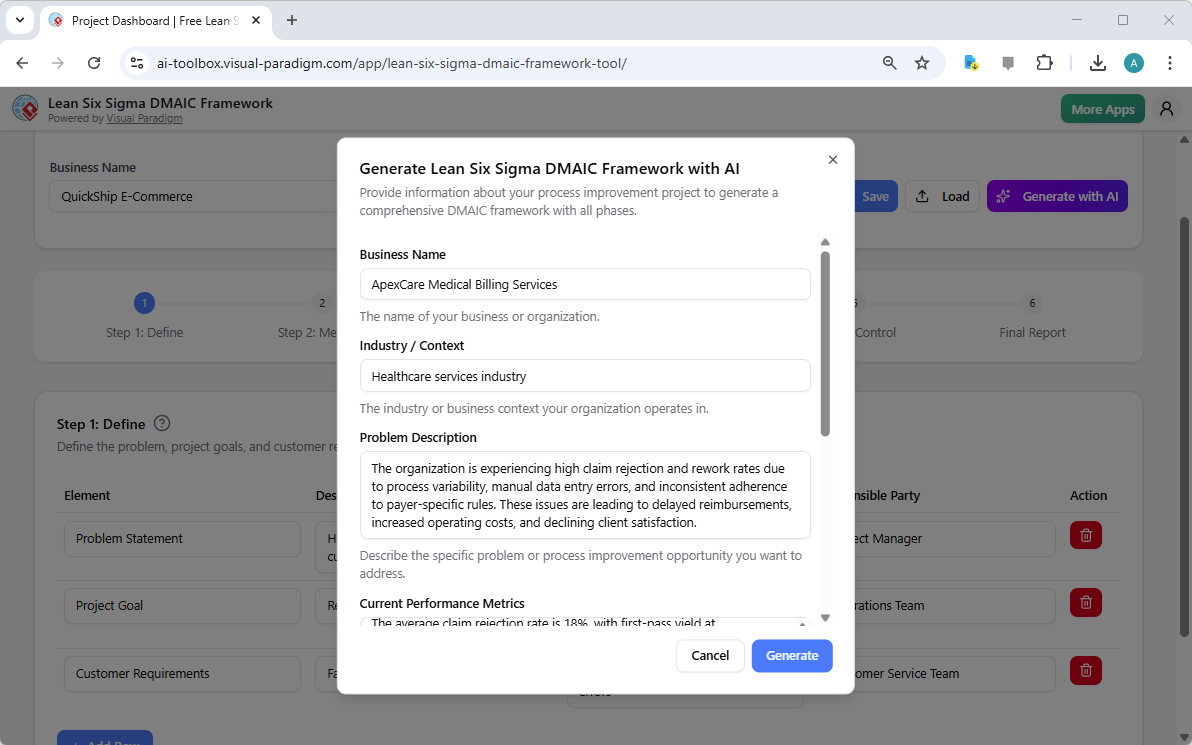
At the heart of the Lean Six Sigma DMAIC Framework Tool is its ability to transform a simple problem statement into a comprehensive, actionable project plan. The process begins with the AI generation screen, where the user provides essential context about their business and the specific challenge they face. In this example, the user has input the business name “ApexCare Medical Billing Services” and the industry “Healthcare services industry.” They then describe the core problem: high claim rejection and rework rates stemming from process variability, manual errors, and inconsistent rule adherence. This initial input is crucial as it provides the AI with the necessary context to generate relevant and accurate project elements.
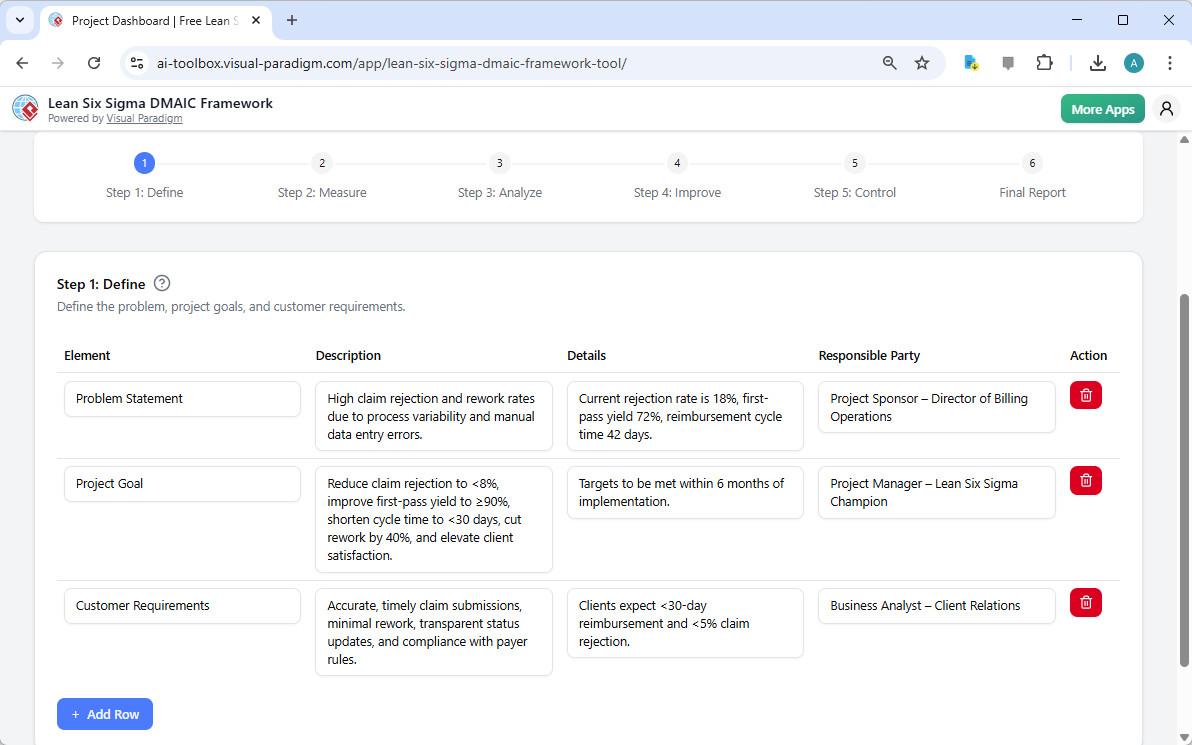
Step 1: Define – Establishing the Project Foundation
After the AI generates the initial project, the user is presented with the first phase: Define. This step focuses on clearly articulating the problem, setting measurable goals, and understanding customer requirements. The image below shows the output of the AI, which has populated the “Define” table with a concise problem statement, a detailed project goal, and specific customer requirements. The tool’s structure ensures that all critical information is captured in a standardized format, making it easy to understand and communicate the project’s purpose. The user can then easily edit or add more rows to refine the details based on their team’s insights.
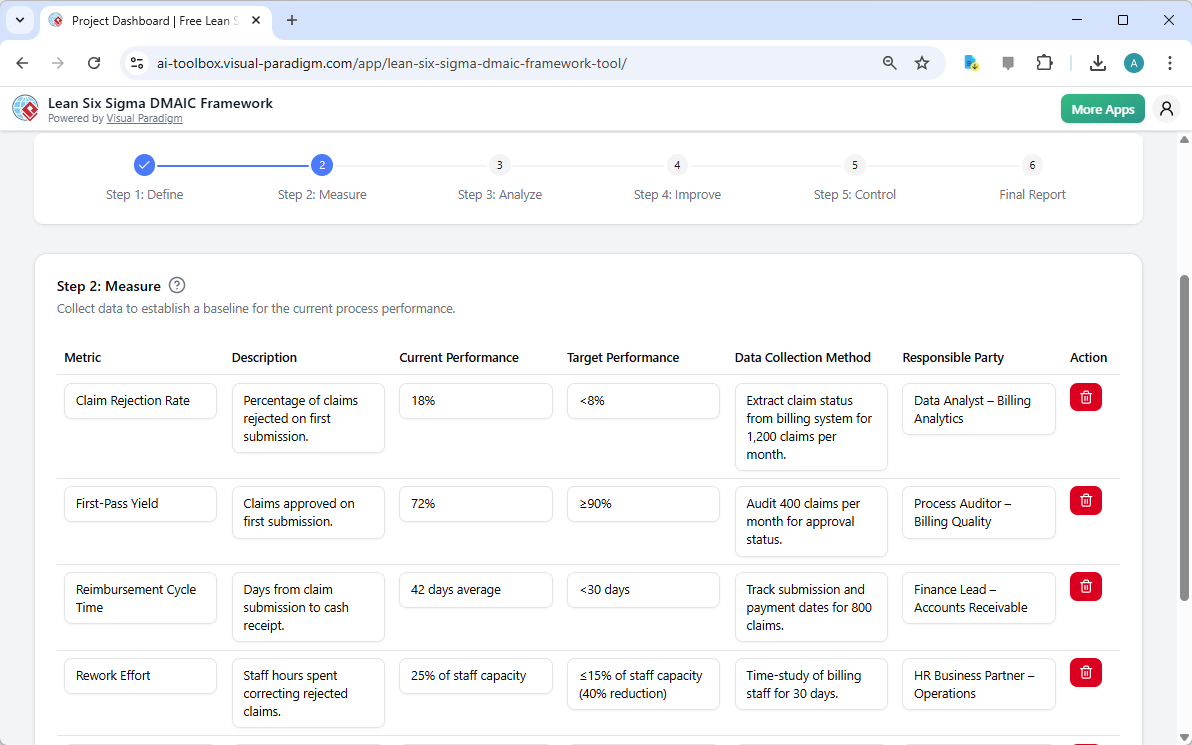
Step 2: Measure – Establishing a Data-Driven Baseline
With the problem defined, the next step is to measure the current performance. The “Measure” phase, as seen below, is where the tool helps users collect and organize key performance indicators (KPIs). The AI has generated a list of metrics relevant to the medical billing process, including the claim rejection rate, first-pass yield, reimbursement cycle time, and rework effort. For each metric, the tool provides a description, the current performance, and the target performance. This structured approach ensures that the project starts with a clear, data-driven baseline, which is essential for measuring the impact of future improvements.
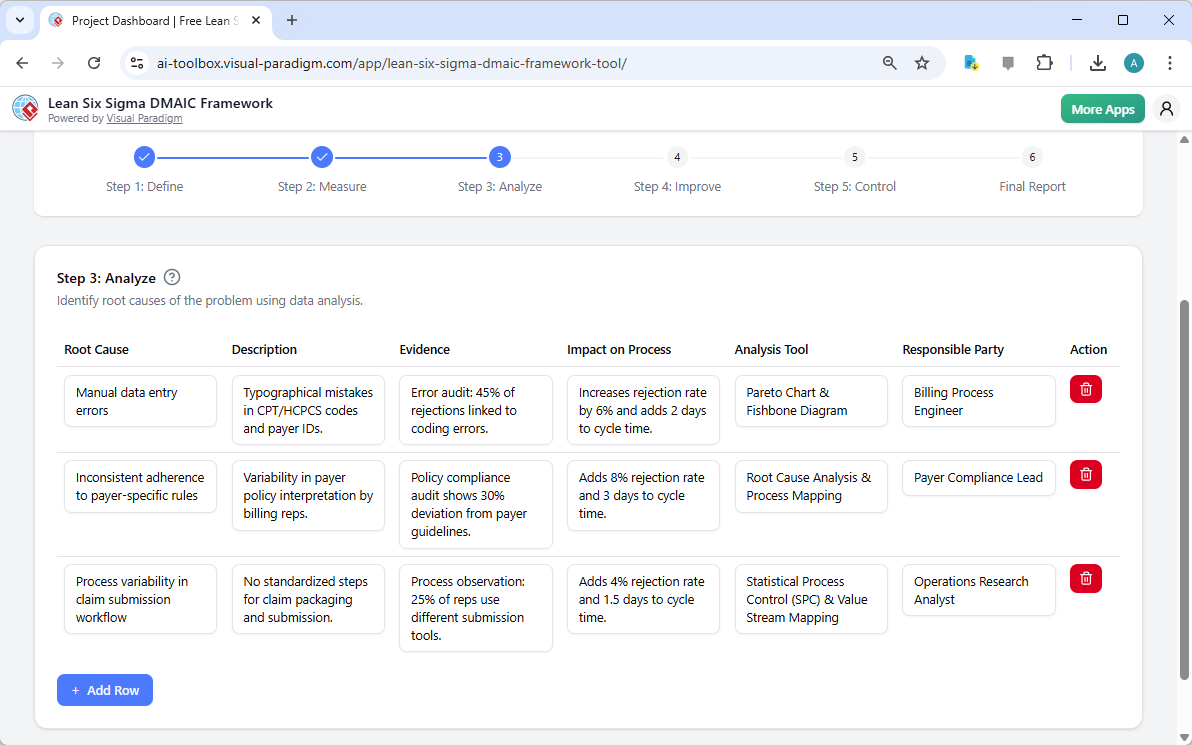
Step 3: Analyze – Identifying the Root Causes
Now that the baseline is established, the focus shifts to the “Analyze” phase, where the goal is to identify the root causes of the problem. The “Analyze” table, which the AI has populated with potential root causes such as “Manual data entry errors” and “Inconsistent adherence to payer-specific rules.” For each root cause, the AI provides a description, evidence, and the impact on the process, along with recommended analysis tools like a Pareto Chart or Fishbone Diagram. This powerful feature helps users move beyond surface-level symptoms and pinpoint the fundamental issues that need to be addressed.
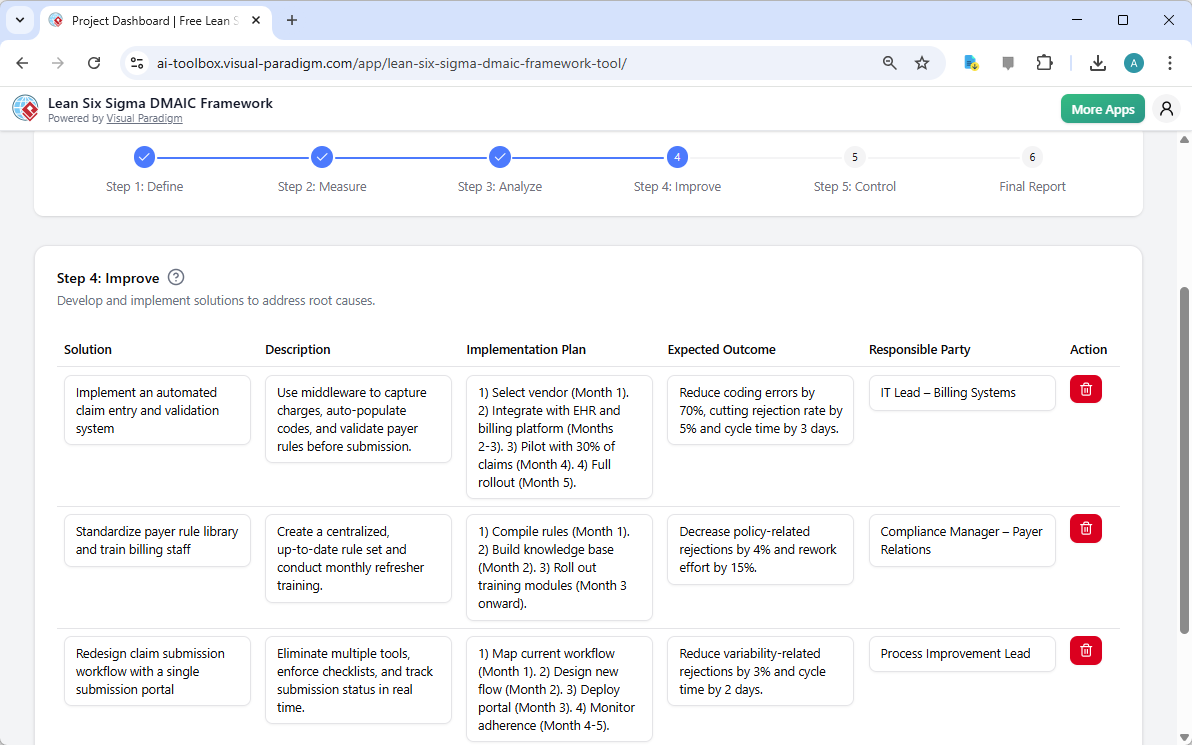
Step 4: Improve – Developing and Implementing Solutions
Once the root causes are identified, the “Improve” phase begins. The image below shows the “Improve” table, where the AI suggests solutions to address the root causes. For example, it proposes implementing an automated claim entry system to reduce manual errors and standardizing a payer rule library to improve consistency. Each solution is accompanied by a detailed implementation plan, expected outcomes, and a responsible party. This structured approach ensures that the solutions are not only effective but also have a clear path to implementation and success.
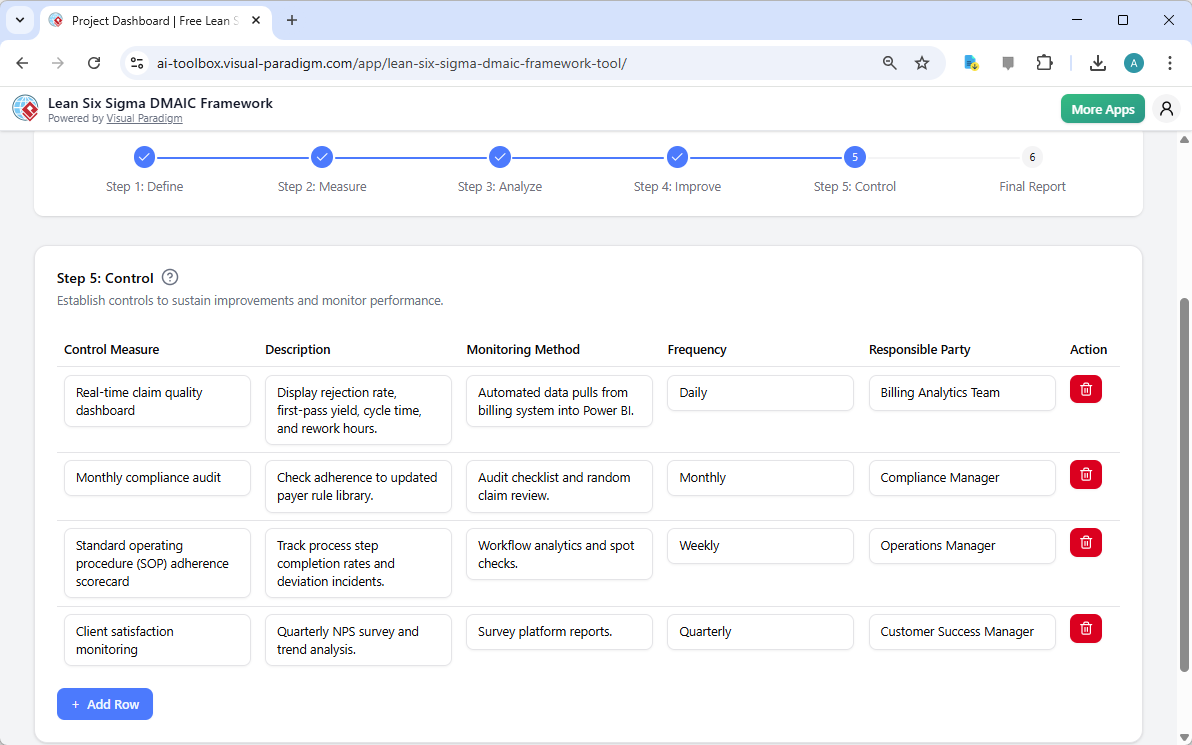
Step 5: Control – Sustaining the Gains
After solutions are implemented, the final phase is “Control,” which focuses on establishing systems to sustain the improvements and prevent regression. The image below illustrates the “Control” table, where the AI has recommended various control measures. These include a real-time claim quality dashboard for daily monitoring, monthly compliance audits, and a standard operating procedure (SOP) adherence scorecard. The tool also specifies the monitoring method, frequency, and responsible party for each control, ensuring that the improvements are actively managed and maintained.
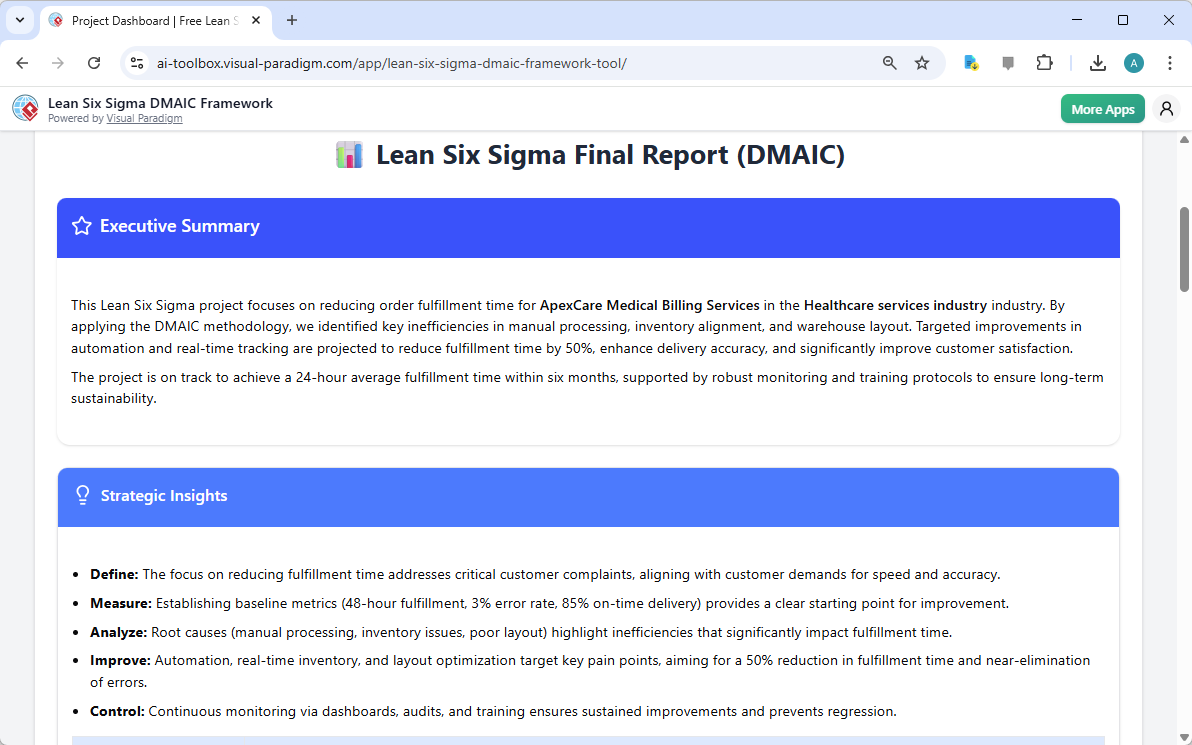
Step 6: Final Report – Consolidating the Project
The journey culminates in the “Final Report” step, which provides a comprehensive summary of the entire DMAIC project. The final output is a professionally formatted report titled “Lean Six Sigma Final Report (DMAIC).” This report includes an executive summary that concisely outlines the project’s focus, methodology, and projected outcomes. It also provides strategic insights for each of the five DMAIC phases, offering a clear and compelling narrative of the project’s value. This report is designed to be printed or saved as a PDF, making it an ideal tool for sharing the project’s findings with stakeholders, leadership, and team members.
Why This AI-Powered Tool is a Game-Changer
The Lean Six Sigma DMAIC Framework Tool is more than just a digital form; it’s a powerful enabler of transformation. Its AI-powered generation capability drastically reduces the time and effort required to create a detailed project plan, allowing professionals to focus on validation and execution. The structured, guided workflow ensures that no critical step in the DMAIC methodology is overlooked, promoting a rigorous, data-driven approach to problem-solving. The ability to save projects locally ensures that sensitive business data remains private and secure. For anyone involved in process improvement, this tool provides a clear, efficient path to achieving operational excellence.
Ready to transform your business processes? Try the AI-Powered Lean Six Sigma DMAIC Framework Tool today and experience the power of AI to accelerate your improvement initiatives.
Related Links
Lean Six Sigma is a rigorous, data-driven methodology that combines lean principles—focused on eliminating waste—with Six Sigma techniques designed to reduce process variation and defects. The DMAIC framework serves as the structural foundation for this approach, guiding teams through five distinct phases: Define, Measure, Analyze, Improve, and Control. To support these phases, practitioners utilize specialized visual tools such as Value Stream Mapping (VSM) to identify bottlenecks and Fishbone (Ishikawa) diagrams paired with the 5 Whys to perform deep-dive root cause analysis. Modern software solutions now offer automated toolsets to manage these processes, providing a centralized repository for modeling, performance metrics, and standardized quality management templates.
-
Visual Paradigm’s Lean Six Sigma DMAIC Framework Tool: A dedicated feature set designed to support process modeling, analysis, and structured improvement using the full DMAIC lifecycle.
-
Six Sigma Process: A Step-by-Step Guide: An overview of the methodology covering core phases, key tools, and practical approaches for driving quality in business operations.
-
Lean Six Sigma Process Improvement Guide with Visual Paradigm: A guide on implementing Lean Six Sigma methodologies to optimize workflows and systematically reduce defects.
-
How to Use Value Stream Mapping in Six Sigma Projects: Explains how VSM supports the DMAIC cycle by revealing bottlenecks and enabling data-driven process improvements.
-
Six Sigma Quality Management Diagram Templates: A collection of pre-built templates for visualizing essential tools like Pareto charts, control charts, and Fishbone diagrams.
-
Fishbone Diagram and 5 Whys – Root Cause Analysis Guide: Details the combination of Fishbone diagrams with the 5 Whys technique to enhance the “Analyze” phase of process improvement.
-
Step-by-Step Guide to Creating a Fishbone Diagram: A practical tutorial on building Ishikawa diagrams to identify root causes in processes, projects, or systems.
-
Cause and Effect Analysis Toolkit: A comprehensive resource including best practices and templates for performing systematic cause-and-effect investigations.
-
Value Stream Mapping Software for Lean Improvement: Cloud-based tools that allow teams to visualize and optimize workflows for lean manufacturing and operational efficiency.
-
Process Improvement Toolset and Analysis: A data-driven suite for identifying inefficiencies and enhancing business performance through detailed process analysis.